
 Worksheets
Geographical Skills- collecting and representing data
Total questions: 7
Worksheet time: 22mins
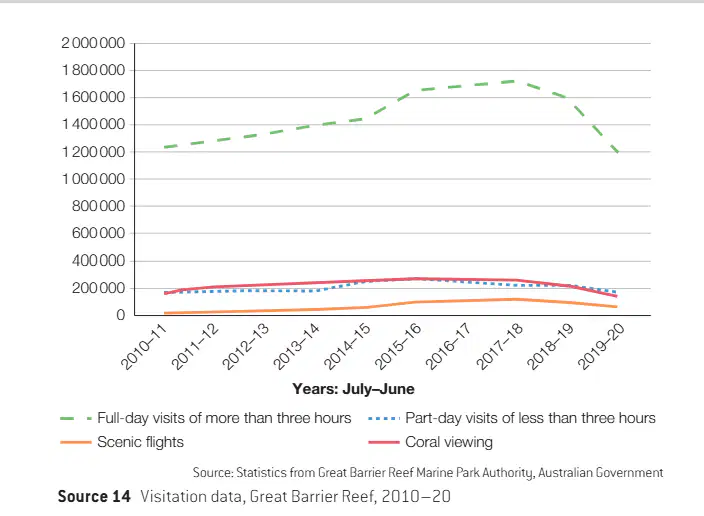
Identify the type of graph used in Source 14
Line graph
Bar Graph
Multiple line graph
Histogram
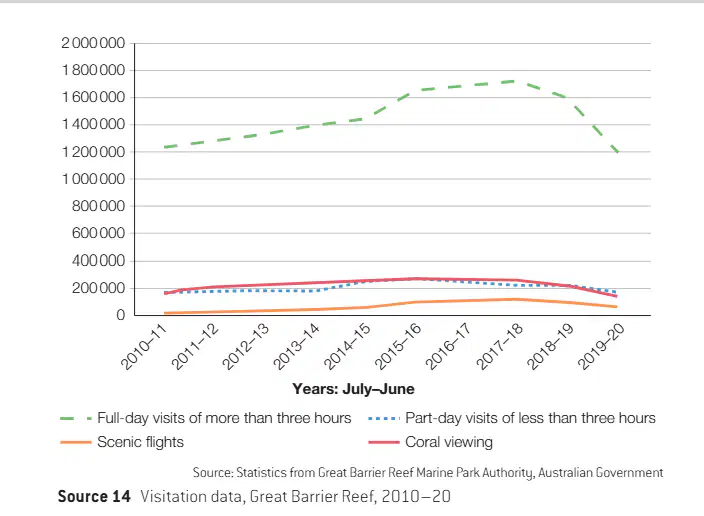
What is the purpose of the graph?
To show a trend or change to particular feature of a geographical topic over time. All lines represent the same feature.
To show a trend or change to particular feature of a geographical topic over time. Each line represents a different feature.
To show how much tourists visited Uluru.
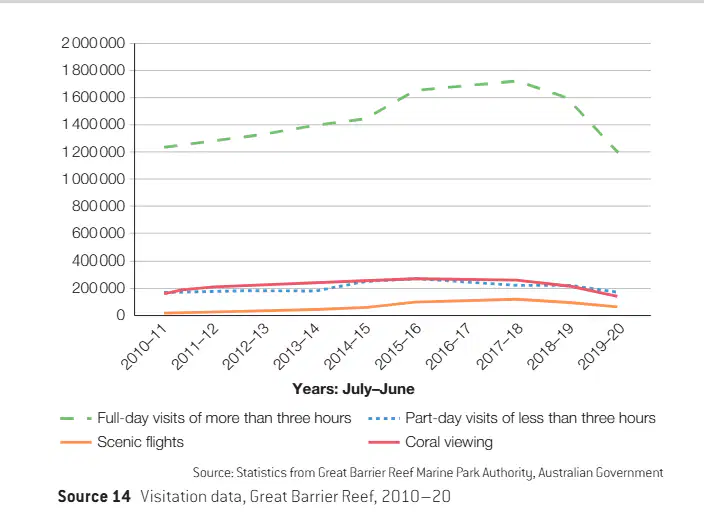
Describe the trend over time in full-day visits
as shown in Source 14. (remember to include numerical data to support your description)

In two paragraghs, compare the trends in the number of visitors to the landscape who listed ‘coral viewing’ as their main activity to the number of visitors who undertook a scenic flight. Remember, when you compare two things you must talk about how they are similar and different, and you include numerical data.

Give reasons for the decline in tourist numbers in
2019–20. What events were happening at the time
that might have discouraged tourism?

Identify the number of visitors to Australia in
January 2019.
A total of 731 100 people visited Australia in January 2019
A total of 831 100 people visited Australia in January 2019
A total of 531 100 people visited Australia in January 2019
A total of 131 100 people visited Australia in January 2019

Calculate the difference between the number
of visitors to Australia in March 2019 and the
number of visitors in the same month in 2020.
The difference between the number of visitors to Australia in March 2019 and March 2020 was 404 100 people.
The difference between the number of visitors to Australia in March 2019 and March 2020 was 505 100 people.
The difference between the number of visitors to Australia in March 2019 and March 2020 was 504 102 people.
The difference between the number of visitors to Australia in March 2019 and March 2020 was 504 100 people.

