
 Worksheets
Unit 1 Test Ecology
Total questions: 23
Worksheet time: 28mins
An ecosystem is:
a community of living and non-living things interacting together
a single animal living alone
only the plants in a forest
just the water in a pond
Limiting factors - _________________ (living) or _________________ (nonliving) factors that restrict the _________________, _________________, or _________________ of a population.
biotic, abiotic, distribution, abundance, growth
abiotic, biotic, increase, decrease, stability
biotic, abiotic, migration, extinction, adaptation
abiotic, biotic, reproduction, mutation, evolution
Examples of Density-Dependent Limiting Factors include:
Competition, predation, disease
Sunlight, temperature, rainfall
Natural disasters, drought, fire
Soil type, pH, mineral content
Examples of Density-Independent Limiting Factors include:
Natural disasters such as floods and fires
Competition for food
Predation
Disease spread
A niche is:
the role or position of an organism in its environment
a type of ecosystem
a physical place where an organism lives
a group of similar organisms
A symbiotic relationship is:
a relationship where two different species live together and benefit from each other
a relationship where one organism eats another
a relationship where organisms compete for resources
a relationship where organisms avoid each other
Types of Interactions: 1. Competition b. Example:
Two animals fighting for the same food source
A bee pollinating a flower
A bird building a nest in a tree
A fungus breaking down dead matter
Types of Interactions: 2. Predation b. Example:
A lion hunting a zebra
A bee pollinating a flower
Two deer fighting for territory
A mushroom growing on a tree
Types of Interactions: 3. Mutualism b. Example:
Bee and flower
Lion and zebra
Tick and dog
Hawk and mouse
Types of Interactions: 4. Commensalism b. Example:
A bird nesting in a tree
A lion hunting a zebra
A bee pollinating a flower
A tapeworm in a dog
Types of Interactions: 5. Parasitism b. Example:
Tick feeding on a dog
Bee pollinating a flower
Lion hunting a zebra
Fish swimming in a school
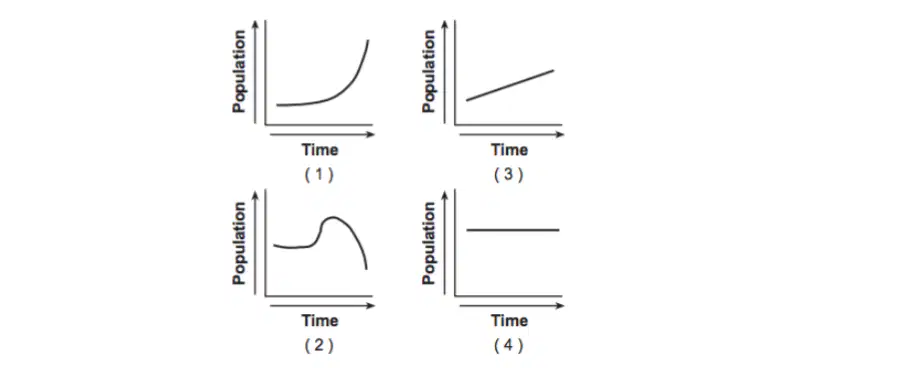
Graphs 1-4 represent possible projections for a bird population over the next 100 years. Which of the following scenarios would best describe the bird population in graph (4)?
Mosquitos begin to infect birds with diseases, like avian malaria, that cause them to die off.
The food supply for these birds increases consistently each year.
The bird population has reached its carrying capacity and is relatively stable.
People are no longer allowed to hunt these birds, causing the population to rapidly increase.

Based on the food web above, what is likely to happen if the Fox population decreases?
The Insect population will increase
The Vole population will increase
The Thrush population will stay the same
The Insect population will decrease

The graph below shows the size of a snake population over 125 years. Which of the following changes would most likely cause the snake population to decrease to a size that is significantly lower than the current carrying capacity?
A. A constant food supply that snakes can hunt.
B. A wildfire breaks out and burns the habitat
C. A behavioral change that helps snakes find more food.
D. Decreased competition between snakes and foxes.
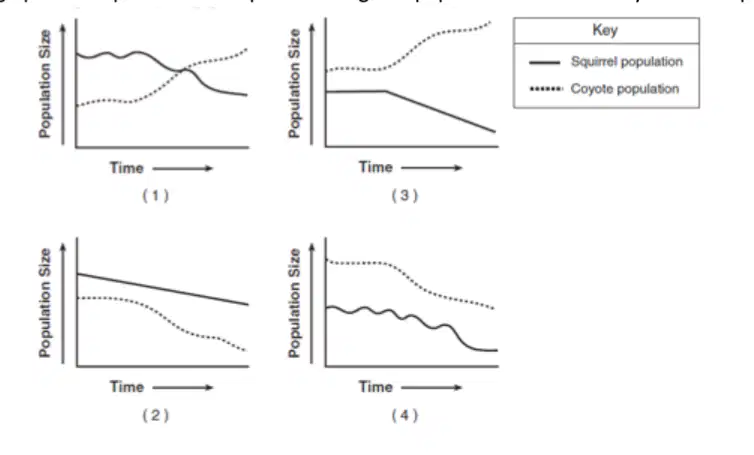
In a particular ecosystem, squirrels make up a large portion of the diet of coyotes. A fatal disease in the squirrel population begins to reduce their population over a period of months. Which graph best represents the expected changes in population size of the coyotes and squirrels?
Graph 1
Graph 2
Graph 3
Graph 4
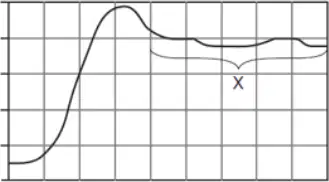
Changes in a deer population are shown in the graph below. Which statement best explains section X?
The population has reached the carrying capacity of its environment.
Energy is used for interbreeding between members of different species.
A predator recycles the remains of dead organisms.
Competition does not occur between members of different species in the same habitat.
Competition for biotic resources can be illustrated by organisms fighting for a limited amount of
air to breathe
water to drink
mates for breeding
space for nesting
Logistic growth is:
a population growth pattern that levels off as resources become limited.
a population growth pattern that increases without limit.
a type of growth that only occurs in plants.
a pattern where population size decreases over time.
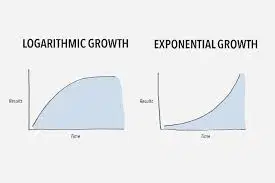
12. Which graph would best represent a situation where the number of bacteria in a culture rapidly increases over time?
A graph showing exponential growth.
A graph showing a straight, horizontal line.
A graph showing a steady decline.
A graph with random fluctuations.

What is the primary purpose of studying dispersion patterns in a population?
To determine the population's growth rate
To predict future population sizes
To understand how individuals are spatially distributed
To calculate the birth and death rates

A region of savanna has 3257 kg of biomass among all the herbivores. Use the Ten Percent Rule to estimate the biomass at each trophic level. Write the estimated energy for each level next to the level.
Producers: 32570 Primary Consumers: 3257 Secondary Consumers: 325.7 Tertiary Consumers: 32.57
Producers: 3257 Primary Consumers: 325.7 Secondary Consumers: 32.57 Tertiary Consumers: 3.257
Producers: 32570 Primary Consumers: 325.7 Secondary Consumers: 32.57 Tertiary Consumers: 3.257
Producers: 32570 Primary Consumers: 3257 Secondary Consumers: 32.57 Tertiary Consumers: 3.257
15. The graph below shows the populations of predators and prey over time. Which lettered description best represents the point where the prey population starts to increase rapidly?
A. The prey population starts to increase rapidly.
B. The predator population is at its peak.
C. Both populations are at their lowest.
D. The predator population starts to decrease.
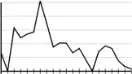
Which of the following statements is the most likely explanation for the decrease in sea urchin abundance seen between 1980 and 1990?
The sea urchin population was reduced by a density-independent factor that had a negative effect on embryo development.
The sea urchin population was reduced by a density-dependent factor that directly caused the environment’s carrying capacity for sea urchin embryos to increase.
The sea urchin population was reduced by a density-dependent factor that had a positive effect on embryo development.
The sea urchin population was reduced by a density-independent factor that directly caused the environment’s carrying capacity for sea urchin embryos to decrease.

