
 Worksheets
Graphing Quiz
Total questions: 16
Worksheet time: 12mins
Name
Class
Date
1.
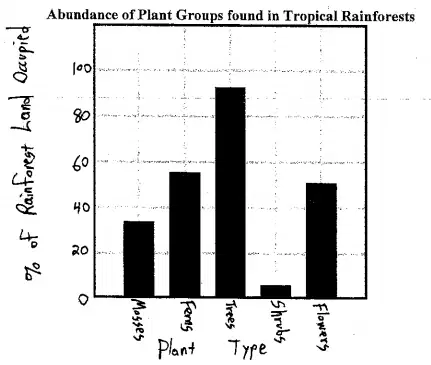
2. According to the bar graph below, which plant groups occupy at least 40% of tropical rainforests?
a)
trees and ferns
b)
trees, ferns, flowers, and mosses
c)
trees, ferns, and flowers
d)
all 5 groups of plants
2.

5. Using the figure below, how much farther had student A traveled than student B at a time of 20 minutes?
a)
10 mm
b)
12 mm
c)
15 mm
d)
20 mm
3.

6. Using the data in the figure below, predict what would happen at a time of 50 minutes.
a)
the distance between student A and student B will be less than 10 mm apart
b)
the distance between student A and student B will be approximately 15 mm apart
c)
there will not be any distance between student A and student B
d)
the distance between student A and student B will increase to about 25 mm apart
4.

7. According to the figure below, determine approximately how many hours of sunlight these plants should receive each day in order to make them grow at their optimum level.
a)
4 hours
b)
12 hours
c)
16 hours
d)
24 hours
5.
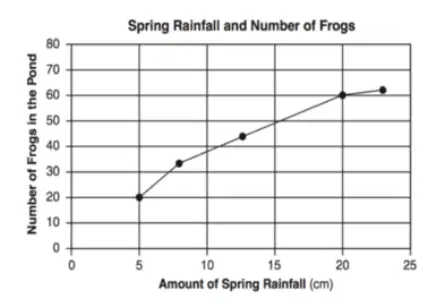
12. What can Reece conclude about the amount of spring rainfall and the number of frogs found in the pond?
a)
As the amount of rainfall increases the number of frogs also increases.
b)
As the amount of rainfall increases the number of frogs decreases.
c)
As the amount of rainfall decreases the number or frog increases.
d)
As the amount of rainfall decreases the number of frogs stays about the same.
6.

13. What correlation can Marcus make in regards to the information detailed in the graph below.
a)
The rise and fall of the tides corresponds largely to the time of day.
b)
The rising water level of the tides happens between 10 Am and Noon and again at 10 PM and Midnight.
c)
The lowest average water level happens between 6 and 8 a.m. and again between 6 and 8 p.m.
d)
All of the above are true statements.
7.
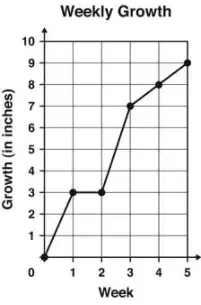
14. Between which 2 weeks was the largest amount of growth observed?
a)
Between week 0 and week 1
b)
Between week 1 and week 2
c)
Between week 2 and week 3
d)
Between week 3 and week 4
8.
Which variable goes on the X axis?
a)
Independent
b)
Dependent
c)
Manipulated
d)
Responding
9.
Which variable goes on the Y axis?
a)
Dependent
b)
independent
c)
Manipulated
d)
Responding
10.
All graphs have to have a (a) ?
11.

What is the dependent variable?
a)
The United States
b)
Population
c)
Year
12.

What type of graph is this?
a)
Bar Graph
b)
Line Plot
c)
Pictograph
d)
Tally Chart
13.

What is the dependent variable?
a)
kilometers
b)
cost
14.

What is the independent variable of the graph?
a)
The number of hours.
b)
The total number of hours.
c)
The total miles.
d)
The number of miles.
15.

Select the correct independent and dependent parts of the graph .
(choose 2 answers)
a)
The independent variable is distance
b)
The independent variable is time
c)
The dependent variable is distance
d)
The dependent variable is time
16.

What type of graph/table is shown?
a)
Frequency Table
b)
Bar Graph
c)
Dot Plot
d)
Pictograph
100 %

