
 Worksheets
Review 1.1, 1.2, 1.4 Proportional Relationships
Total questions: 25
Worksheet time: 20mins
What is the most common version of the equation for proportional relationships?
y = kx
x = my + b
y = x + k
y = k/x
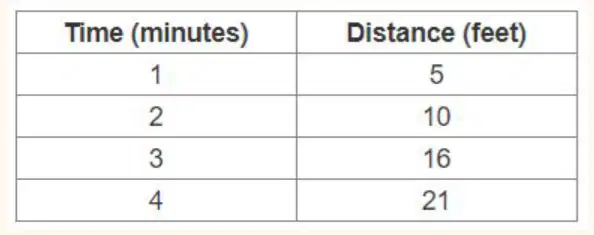
Is the relationship between time (minutes) and distance (feet) in the given table proportional?
Yes, because the ratio between time and distance is always the same.
No, because the ratio between time and distance is not always the same.
Yes, because the distance increases by the same amount each time.
No, because the time values are not proportional.

The amount of money Chaz earned for walking dogs is given in the table. Can the relationship be described by a constant rate?
No, because Chaz doesn't walk the same number of dogs in any situation.
Yes, because both the number of dogs walked and amount earned increase.
No, because the number of dogs walked doesn't increase in an even amount.
Yes, because the constant of proportionality is $18.75.
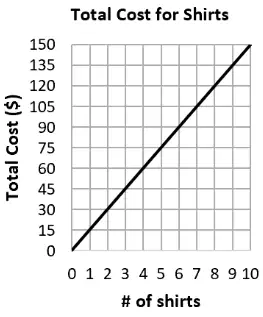
What is the constant of proportionality shown in the graph?
1
150
15
30

If the yield of a garden is 2.6 pounds for each tomato plant, which formula represents y, the total yield of tomatoes, for a garden containing x plants?
y = 2.6x
y = 2.6/x
y = x/2.6
y = 2.6 + x
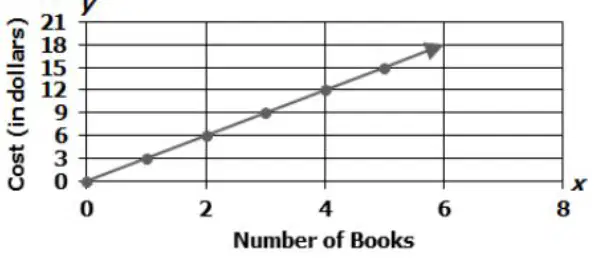
How much will it cost to buy 8 copies of a book?
$24
$18
$21
$16

Which of the following statements is FALSE?
The line goes through the point (3,64), which means that there are 64 cases in 3 cans.
The line goes through the point (6, 96), which means that there are 96 cans in 6 cases.
The line goes through the point (8, 128), which means that there are 128 cans in 8 cases.
The line goes through the point (9, 160), which means that there are 160 cans in 9 cases.
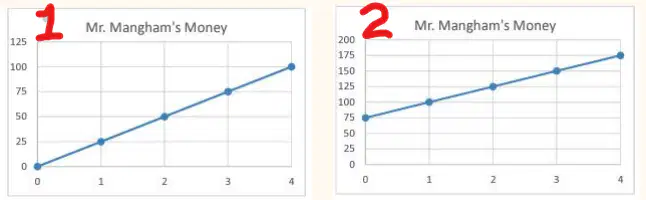
Which graph is NOT proportional? Why?
Graph 1 (starts at the origin)
Graph 2(starts above the origin)
Both graphs are proportional because both lines are straight.
Graph 1 (Dollar amounts aren't even.)
If a car travels at a constant speed and covers 120 miles in 2 hours, what is the constant of proportionality between distance and time?
60
120
2
240
The cost of 54 tickets to a water park is $972. Each ticket costs the same amount.
Which table or equation represents the relationship between the number of tickets, t, and the total cost of the tickets, c?
Select TWO correct answers.
Which situation represents a proportional relationship?
Select the correct answer ○ in each row.

The table shows the weights of bananas at a grocery store. Complete the table so there is a proportional relationship between the number of bananas and their weight.
1 banana
0.32
3 bananas
0.96
8 bananas
2.56
12 bananas
3.84

What missing value makes the table proportional?

A table of x- and y-values is shown below.
What is the constant of proportionality that relates y to x?

The graph shows the total number of markers in 1, 2, 3, and 4 boxes of markers. What is the constant of proportionality?

What is the constant of proportionality?
12
48
2
24

The table is (a) , because it (b) a constant ratio.
If so, what is the constant of proportionality? (c)
non-proportional
proportional
does not have
has
no constant
k=14

Choose whether each statement is sometimes, always, or never true.
The graph of a proportional relationship is a straight line
Always
A proportional graph always passes through the point (0, 1)
Never
A relationship shown in a table is proportional
Sometimes
In a proportional relationship, y = 0 when x = 0
Always
Select the graphs that show a proportional relationship between x and y.

In this graph what is the value of k?
The graph shows the total number of markers in different numbers of boxes of markers. Select all the below statements that are TRUE?
The unit rate is 8 markers per box.
k = 8
There is NOT a proportional relationship between the number of marker and number of boxes.
All boxes have the same amount of markers.
k = 4
Two quantities are (a) if the ratios comparing them are equivalent.
Match the following.
Ratio
a comparison of 2 quantities by division
Origin
Point (0,0) on a graph
K
constant of proportionality
Percent
means per 100
Unit Rate
ratio where one term's value is 1
Two quantities x and y have a _____________if y is always a constant multiple of x.
proportional relationship
biased
ratio
nonproportional relationship
A relationship in which the values for one quantity are each multiplied by the same number to get the values for the other quantity.
proportional relationship
linear relationship
constant of proportionality
linear equation

