
 Worksheets
Unit 1 Review
Total questions: 13
Worksheet time: 18mins
Identify the type of variable: Number of cars in the student parking lot
Quantitative, discrete
Quantitative, continuous
Categorical
Ordinal
Identify the type of variable: Brand of cars in the teacher parking lot
Quantitative, discrete
Quantitative, continuous
Categorical
Ordinal
Identify the type of variable: Wingspan of Florida moths
Quantitative, discrete
Quantitative, continuous
Categorical
Ordinal
Which of the following would NOT be an appropriate way to display the height of all EHS staff?
A dot plot
A histogram
A bar graph
A stem plot

What makes the graph deceptive?
The y-axis does not begin at zero.
The graph is not appropriate for the type of data.

Describe the shape of the distribution.
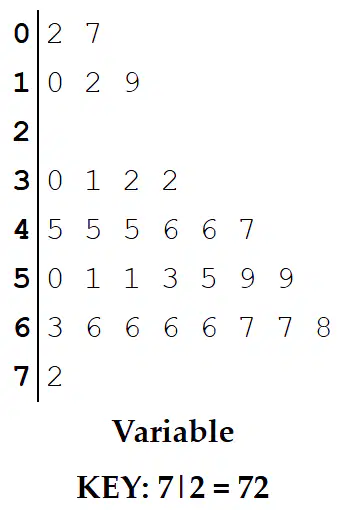
Describe the shape of the distribution.
Left-Skewed
Right-Skewed
Symmetric
Bottom-Skewed
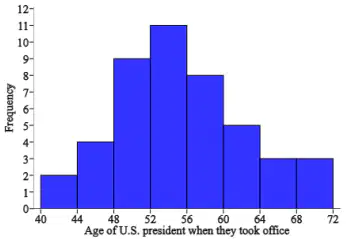
The histogram displays the ages of the first 45 US Presidents when they took office. What percentage of presidents took office before the age of 60? (round to the nearest tenth)
(a)

Which is the most appropriate measure of the center of the data?
Mean
Standard Deviation
Median
Range
What will happen to the standard deviation when a value of 30 is added to the following data?
20, 25, 35, 40
Calculate the IQR of the data:
1,1,2,2,2,3,3,3,5,5,7,10,10,15
(a)
Calculate and select any outliers in the data:
1,1,2,2,2,3,3,3,5,5,7,10,10,15
1
10
15
There are no outliers in the data.
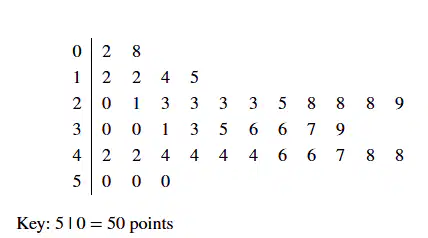
Forty students took a statistics exam having a maximum of 50 points. The distribution of score is given in the stem-and-leaf plot.
The standard deviation of this distribution of exam scores is about 13. Which of the following is a correct interpretation of this value?
Every student’s exam score is within 13 points of the mean.
The gap between the highest and lowest score on the exam is 13 points.
The exam scores typically vary from each other by 13 points.
The exam scores typically vary from the mean by 13 points.

