
 Worksheets
1. Patterns and Projections Review 25-26 (Geo)
Total questions: 31
Worksheet time: 16mins
An address of coordinate can be used to determine which of the following characteristics of a place?
Absolute Location
Relative Location
Patterns of Distribution
Absolute Distance
Relative Distance
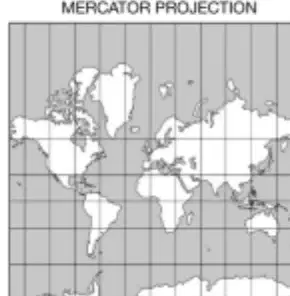
Compare the two maps shown, then chose the correct answer: Which of the following is a characteristic of the MERCATOR map projection?
The area of some places on the Mercator are incorrect, especially near the poles.
The Robinson map is correct in both size, direction and distance, because it most resembles a globe.
Countries near the Equator appear 50% larger than they are in reality
All sizes and distances on the Mercator projection are real and accurate
Greenland and Africa on both maps are the correct sizes
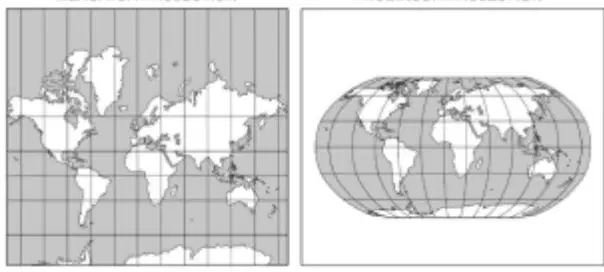
Which of the following statements about the ROBINSON projection is correct?
The Robinson Projection is more useful for navigation than the Mercator Projection.
The Robinson Projection is more accurate in showing the sizes of countries in higher latitudes than the Mercator Projection.
The Robinson Projection is more useful in showing the distribution of human population than the Mercator Projection.
The Robinson Projection was created during the height of sea travel during the Age of Exploration.
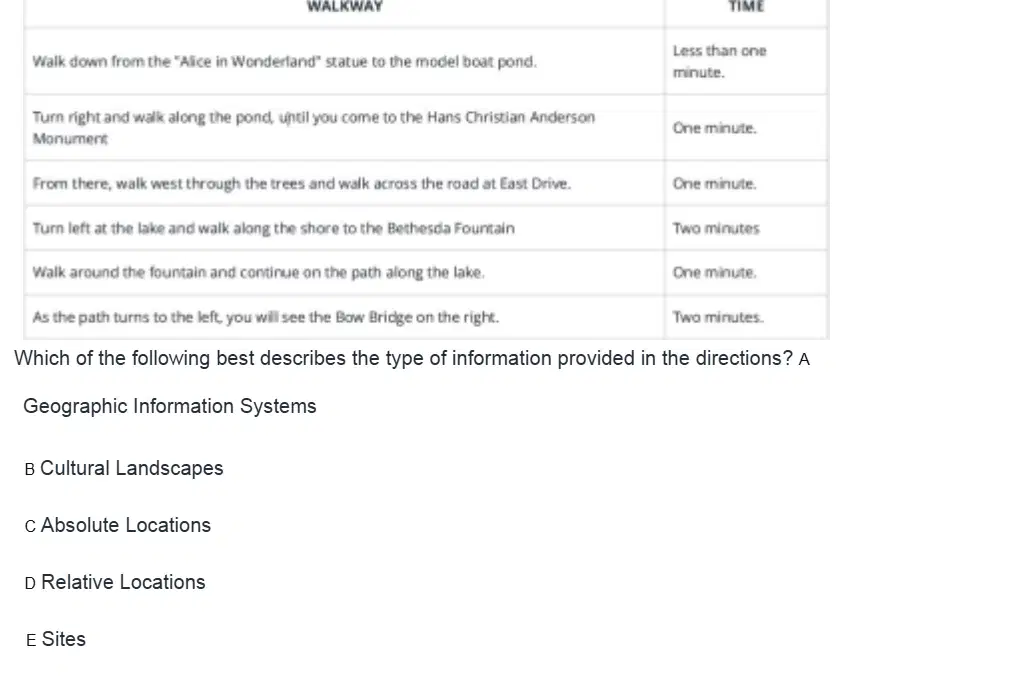
Which of the following best describes the type of information provided in the directions?
Geographic Information Systems
Cultural Landscapes
Absolute Locations
Relative Locations
Sites
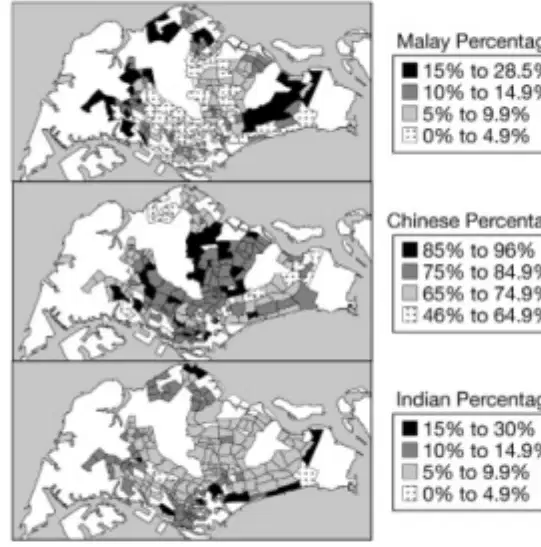
The above maps are using shades of gray to show residential neighborhoods in the country of Singapore divided by ethnicity. Which of the following types of map is this?
Choropleth
Isoline
Cartogram
Graduate Dot
Graduated Symbol
Every map projection has some degree of distortion because...
The Earth is not a perfect sphere.
Lines of Latitude and lines of Longitude do not intersect at right angles.
A curved surface like the Earth cannot be represented on a flat surface without distortion.
Lines of Latitude are shorter than lines of Longitude
Accurate maps do not actually have distortions.
The Washington Monument is located at a latitude of 38.8895°N and a longitude of 77.0353°W. Its address is 2 15th Street Northwest, Washington DC, 20024. Both of these are examples of....
Relative Location
Absolute Location
Physical Features
National Monuments
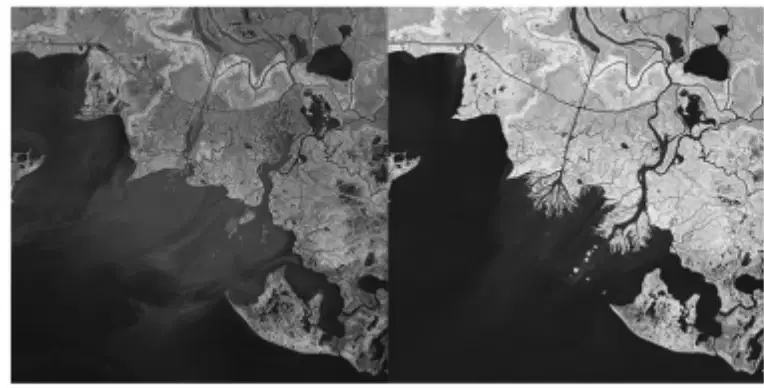
This map shows changes to a portion of the Louisiana coast between 1984 and 2017. Which type of map is this?
A Physical Map
A Political Map
A Plat Map
A Road Map
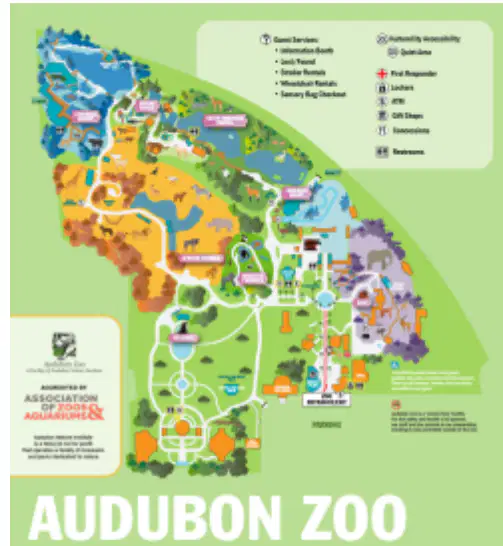
What type of pattern are the animals in this map arranged in?
Linear
Cluster
Circular
Dispersed
Random
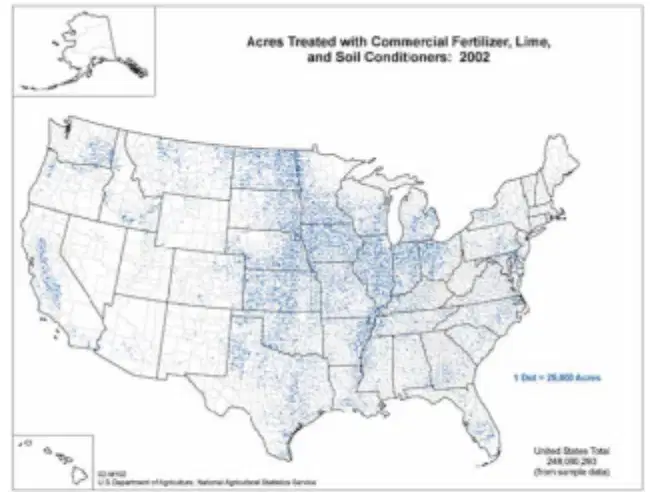
Identify the map shown below:
Choropleth Map
Graduated Symbol Map
Dot Density Map
A Physical Map
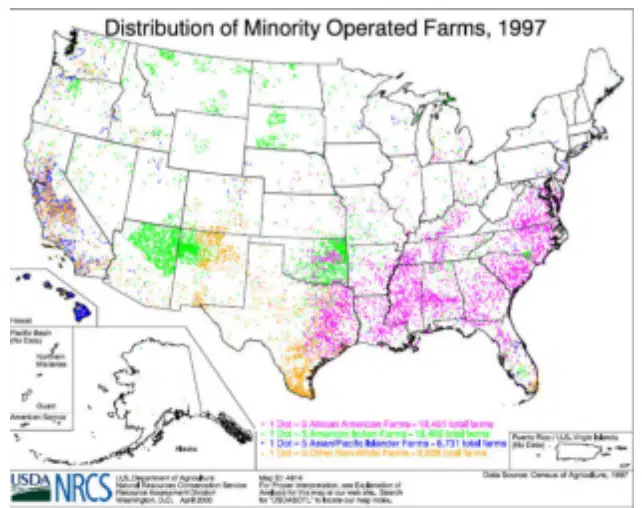
Analyze the map below and select the most correct statement.
Dot Maps are most useful for analyzing climate trends and weather patterns.
Choropleth Maps are important tools for navigation from place to place.
This map is a Thematic Map that is showing us the spatial aspects of farms and minority farmers.
Distribution of Minority Owned Farms, 1997 provides an accurate picture of American agricultural output for the year 1997.
Which of the following terms best describes a map whose main purpose is to show us the official divisions within part of the world, such as names of countries, states or even cities?
Political Map
Plat Map
Physical Map
Thematic Map
Cartogram Map
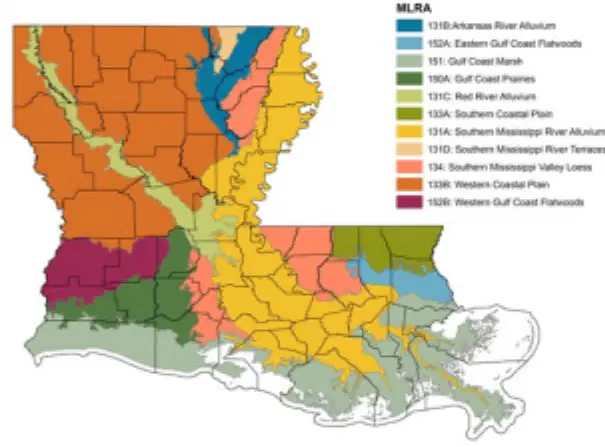
This map is showing us the 11 soil regions in Louisiana. What type of Thematic Map is this?
Choropleth Map
Isoline Map
Graduated Dot Map
Symbol Map
Cartogram Map
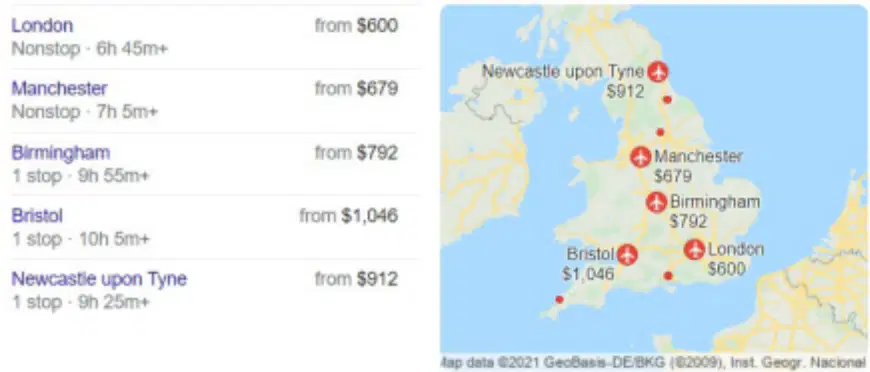
Based on the image above, what type of distance could you use to describe the distance to England?
Absolute Distance
Relative Distance
Geometric Distance
Nautical Distance
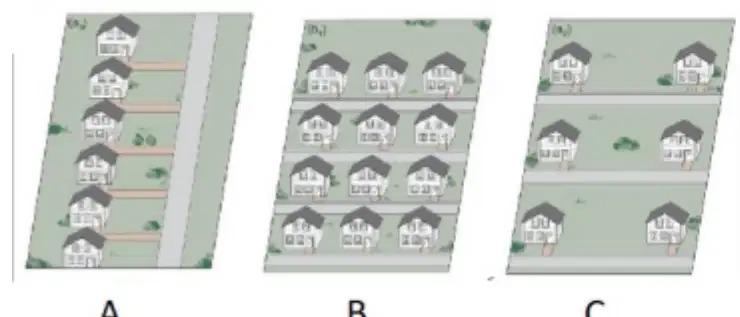
Of the three lots shown in the photo below, which one would be considered the most dispersed?
Lot A
Lot B
Lot C
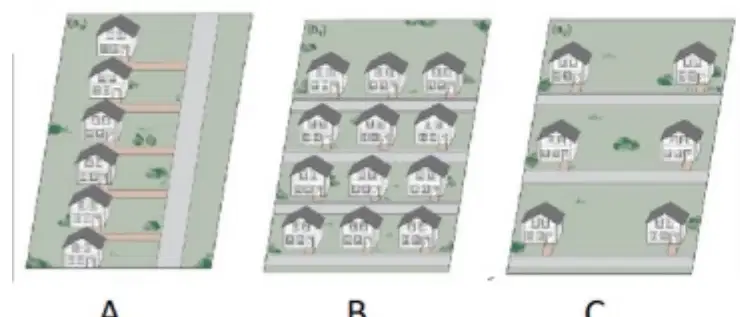
Of the three lots shown in the photo below, which one would be considered a linear pattern of distribution?
Lot A
Lot B
Lot C
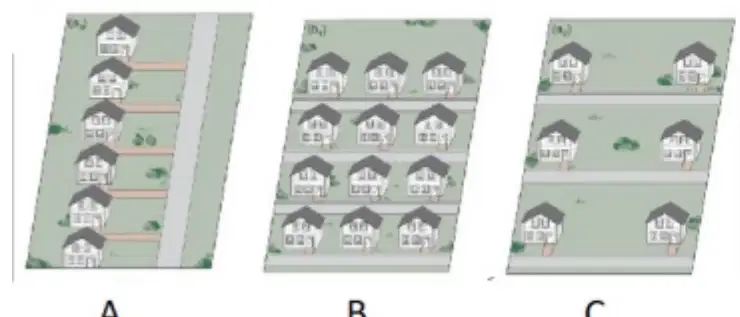
Of the three lots shown in the photo below, which one would be considered a clustered pattern of distribution?
Lot A
Lot B
Lot C
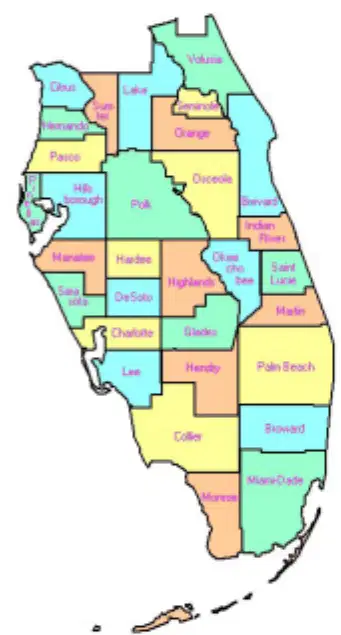
The different colors represent average income levels in these Florida counties. Which two types of maps is this map?
Political
Choropleth
Isoline
Physical
Cartogram
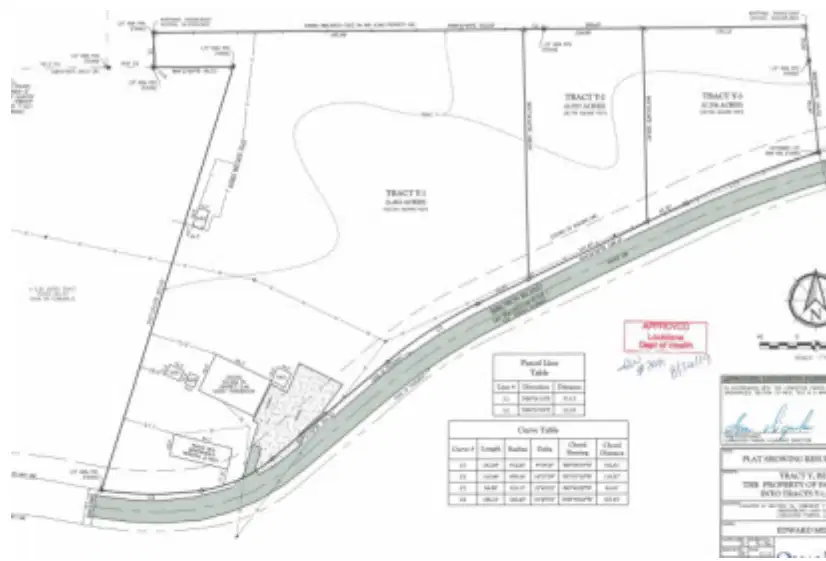
Which type of map is represented on the image?
Political Map- This map shows towns and township areas in a county or parish.
Regional Map- This map shows states or provinces in one part of the country
State or Province Map - This map shows the counties or parishes in a state or province
Plat Map- This map shows property lines and the names of the property owners
National Map- This map shows an entire country
How does the climate and air change as elevation increases?
It get colder as elevation increases
It gets warmer as elevation increases
It gets more humid as elevation increases
It gets less humid as elevation increases
Which of these is not one of the 4 types of reference maps?
Political
Physical
Plat
Cartogram
How does a Cartogram map show data?
It changes the size of places shown to be relative to the amount of the data that exist in that area
It uses lines that connect points of equal value to depict variations in the data across space
It uses symbols of different sizes to indicate different amounts of something
It uses dots to show specific location and distribution of something across a map
How does a Isoline map show data?
It changes the size of places shown to be relative to the amount of the data that exist in that area
It uses lines that connect points of equal value to depict variations in the data across space
It uses symbols of different sizes to indicate different amounts of something
It uses dots to show specific location and distribution of something across a map
All phenomena are equally spaced from a central point. Often times will be centered around a service that exist in a dispersed pattern.
Dispersed Pattern
Circular Pattern
Random Pattern
Clustered Pattern
Which type of phenomena is most likely to exist in a geometric pattern of distribution?
(there are two correct answers)
Zones of Police service
A mountain range
Rows of desks in a Geometry classroom
What type of pattern of distribution is typically not worth tracking because the data will not be useful for making geography decisions?
Dispersed patterns
Linear Patterns
Random Patterns
Geometric Patterns
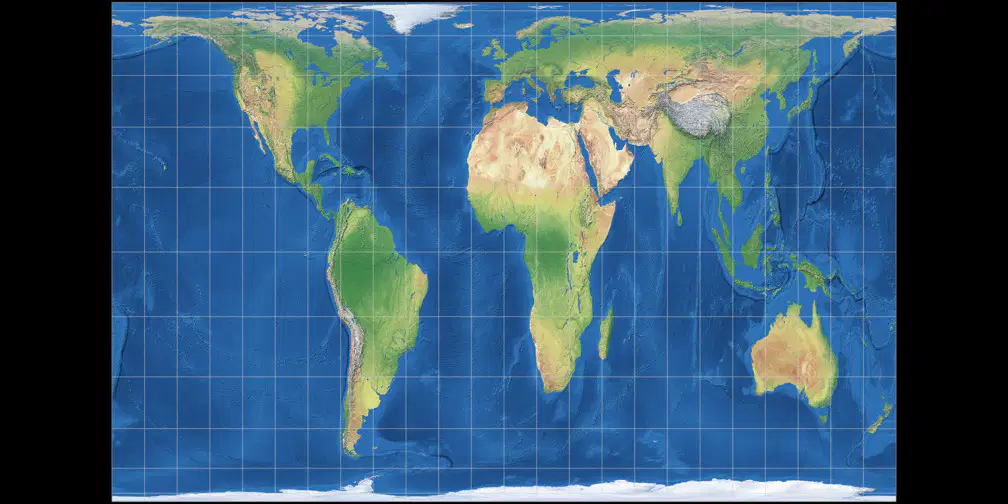
What type of map projection is this? (Notice how the land masses are shaped near the North and South Pole)
Mercator
Peters
Robinson
Conic
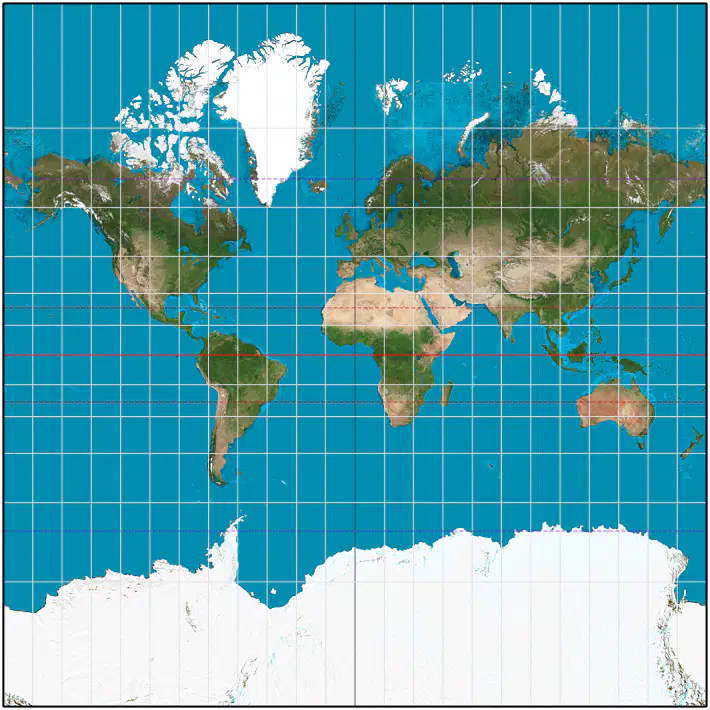
what does this map show correctly and incorrectly? (notice the landmasses near the poles)
Shows size correctly, shows shapes incorrectly
Shows shape correctly, shows size incorrectly
Shows all aspects incorrectly, but only slightly so it looks the most accurate
Shows the mid-latitude correctly, but can only show one of the poles completely
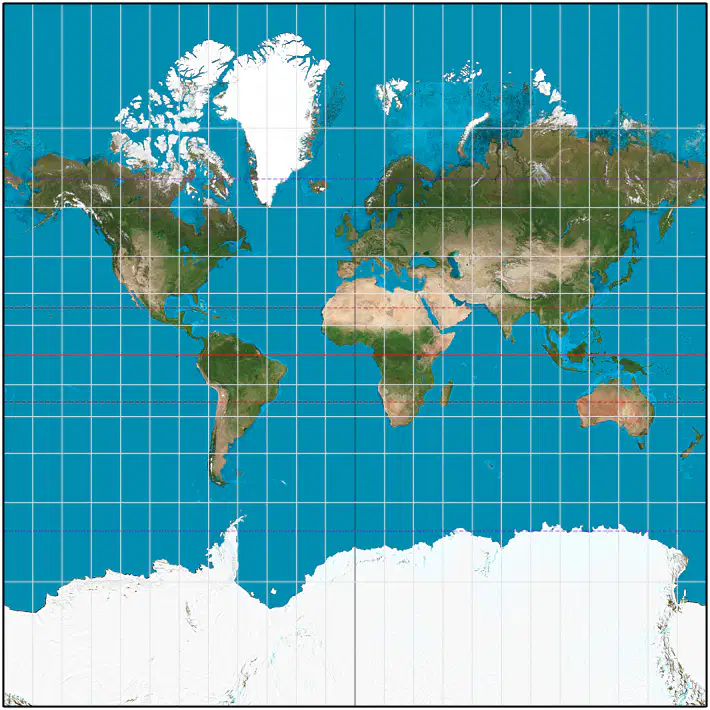
Using Source 1 and your knowledge of Geography, what type of map projection is this?
Mercator
Peters
Robinson
Goode's Homolosine
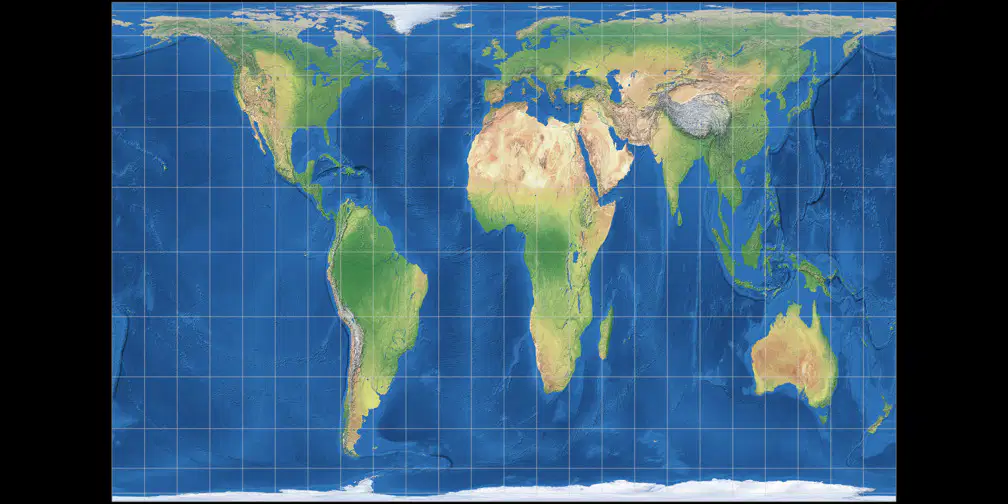
Using Source 1 and your knowledge of Geography, what does this map show correctly and incorrectly?
Shows size correctly, shows shapes incorrectly
Shows shape correctly, shows size incorrectly
Shows all aspects incorrectly, but only slightly so it looks the most accurate
Shows the mid-latitude correctly, but can only show one of the poles and does not show them correctly
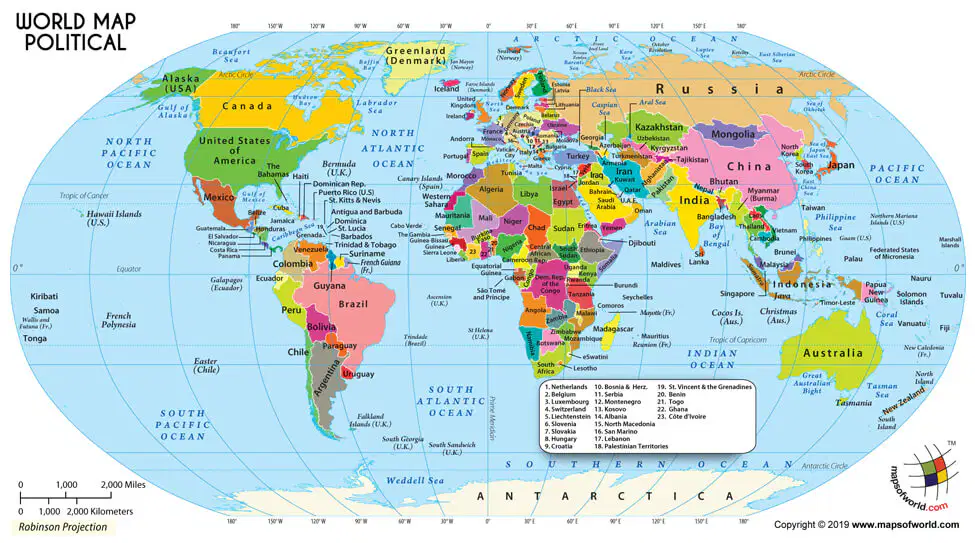
Analyze this Robinson Map Projection: Choose which 3 statements that best describe the characteristics of this map
This map projection is designed for navigation because the lines are straight and easy to follow.
This map shows the size of the landmasses correctly, but distorts the shape and directions.
This is a Political map
This is one of the most common maps used, looks the most accurate to the average person.
This map has no major distortion in size or shape

