
Font size
 Worksheets
Practice Set A
Total questions: 100
Worksheet time: 50mins
The Strait of Malacca separates which countries?
Malaysia and Thailand
Vietnam and the Philippines
Indonesia and Papua New Guinea
Malaysia and Indonesia
What is the capital of Israel?
Damascus
Brunei
Ankara
Jerusalem
Which of the following countries does not have a part of the Himalayas within its borders?
India
Nepal
Laos
Bhutan
Which of the following is not a country in the Arabian Peninsula?
Qatar
Yemen
Sanaa
Oman
The Dead Sea is located between which two countries?
Israel and Palestine
Turkey and Iraq
Jordan and Israel
Lebanon and Syria
Which country in Asia is an archipelago?
Indonesia
Mongolia
North Korea
Turkey
The Caspian Sea is located between which two countries in Asia?
Iran and Iraq
Russia and China
Kazakhstan and Uzbekistan
Turkmenistan and Azerbaijan
The Mekong River does not flow through which of the following countries?
Vietnam
Japan
Thailand
China
What country has two capitals?
Kyrgyzstan
Mongolia
Sri Lanka
Syria
Which of the following cities has a population of between 500,000 to 1,000,000 and is the farthest east?
Kandahar, Afghanistan
Sapporo, Japan
Mecca, Saudi Arabia
Chita, Russia
What do the curved black lines running vertically across the map indicate?
Latitude
Longitude
Time Zones
None of the above
Which of the following features are displayed on the political relief map?
Climates zones
Elevations
Land Cover Type
None of the above
Which country is not located on the mainland?
Russia
Sri Lanka
Kazakhstan
Thailand
The Gobi Desert is located in which country?
Mongolia
Iran
Cambodia
Pakistan
What country’s capital can be found at 38.5° N, 68.7° E?
Turkey
China
Tajikistan
None of the above

According to the map 'Renewable Energy Sites By County,' which county has the most solar energy sites?
Plum
Tursa
Moon
Bloom
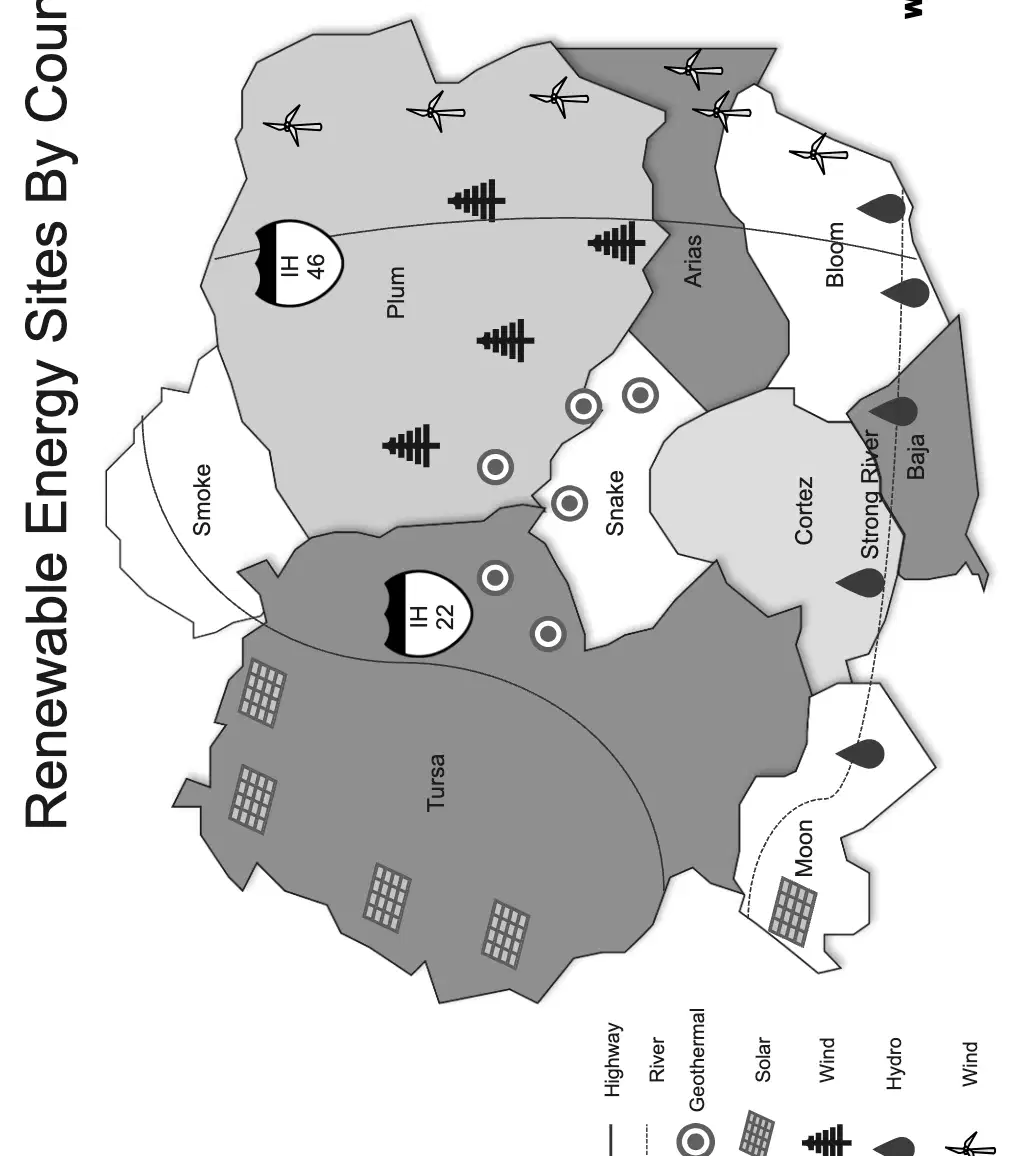
According to the map 'Renewable Energy Sites By County,' which type of renewable energy is represented by the tree symbol?
Solar
Wind
Hydro
Geothermal
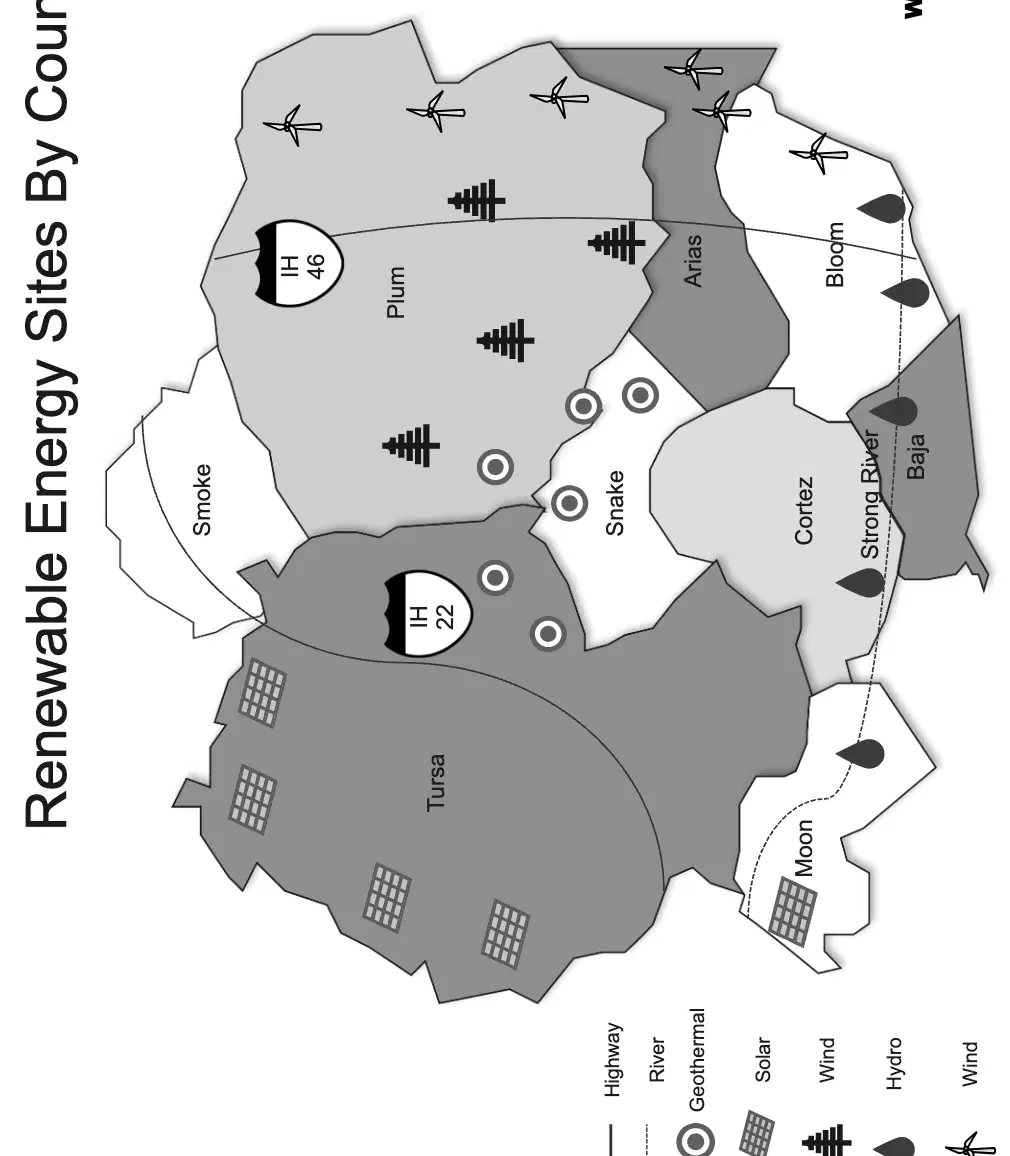
According to the map 'Renewable Energy Sites By County,' which counties have wind energy sites?
Plum, Arias, Bloom
Tursa, Moon, Cortez
Snake, Baja, Strong River
Smoke, Moon, Cortez
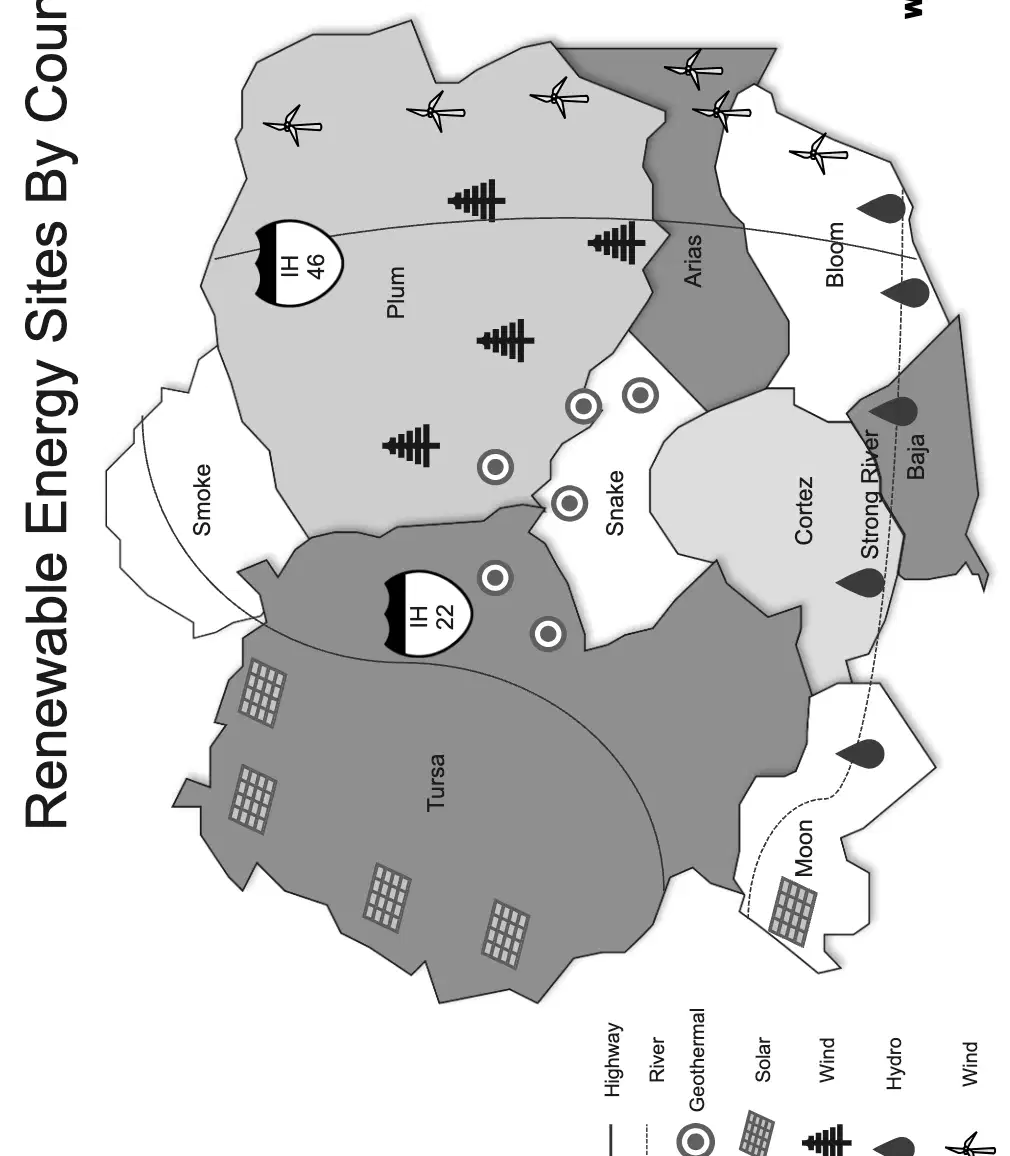
According to the map 'Renewable Energy Sites By County,' the county that has hydro energy sites is:
Jefferson County
Franklin County
Madison County
Lincoln County
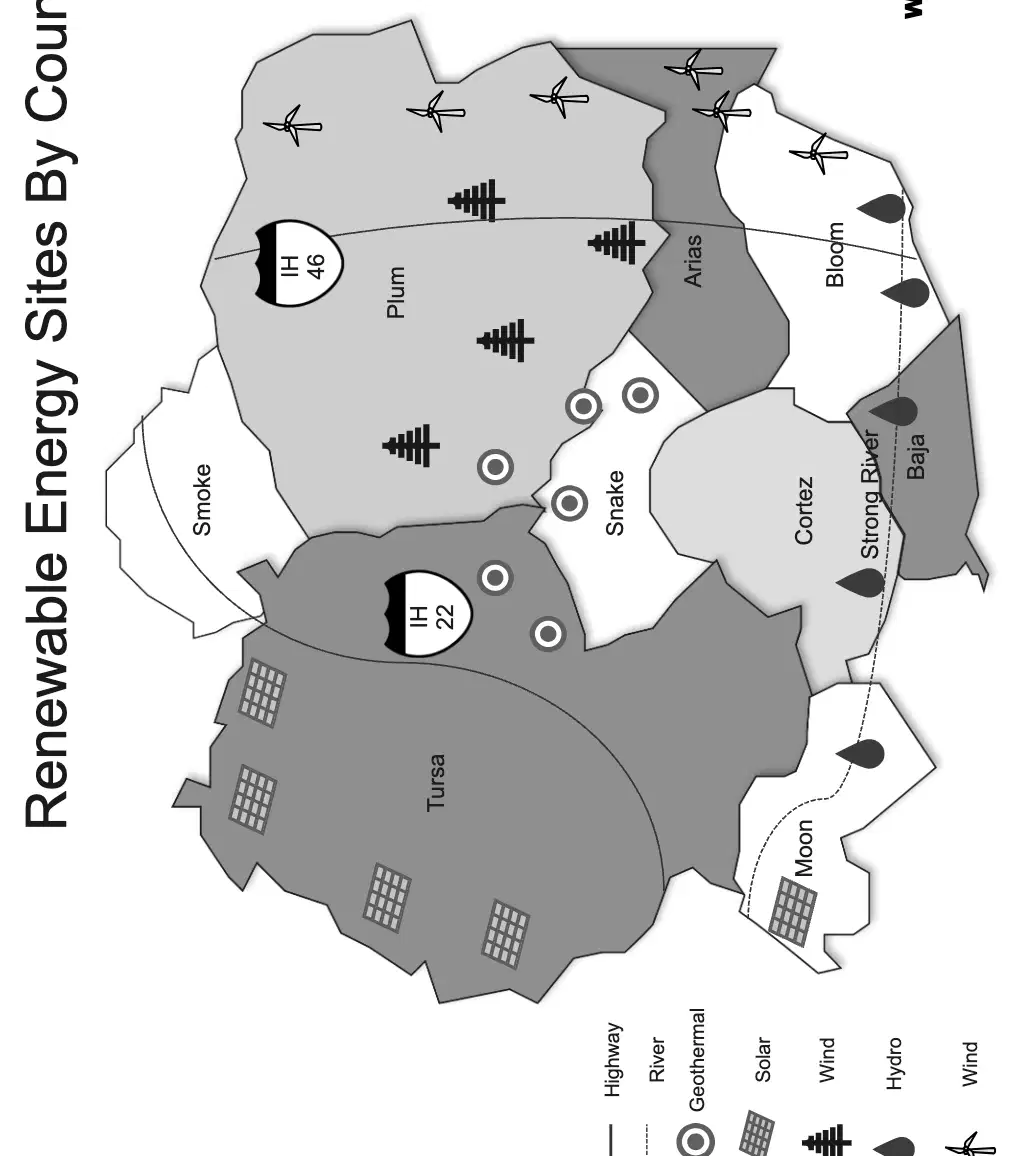
According to the map 'Renewable Energy Sites By County,' the symbol for geothermal energy is a ________.
circle with a dot in the center
triangle
square
star
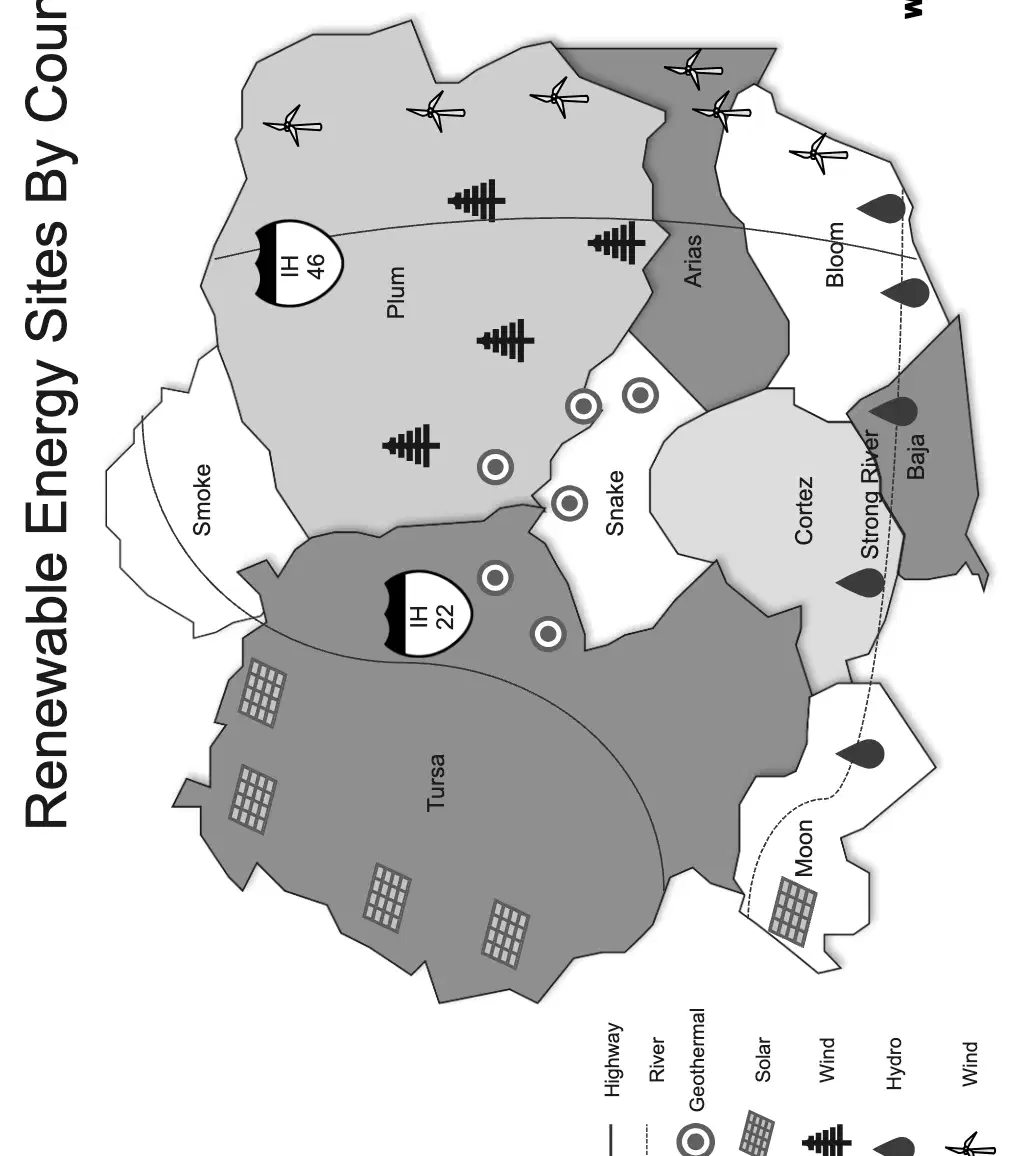
According to the map 'Renewable Energy Sites By County,' the county that has both solar and hydro energy sites is:
Jefferson County
Franklin County
Madison County
Lincoln County
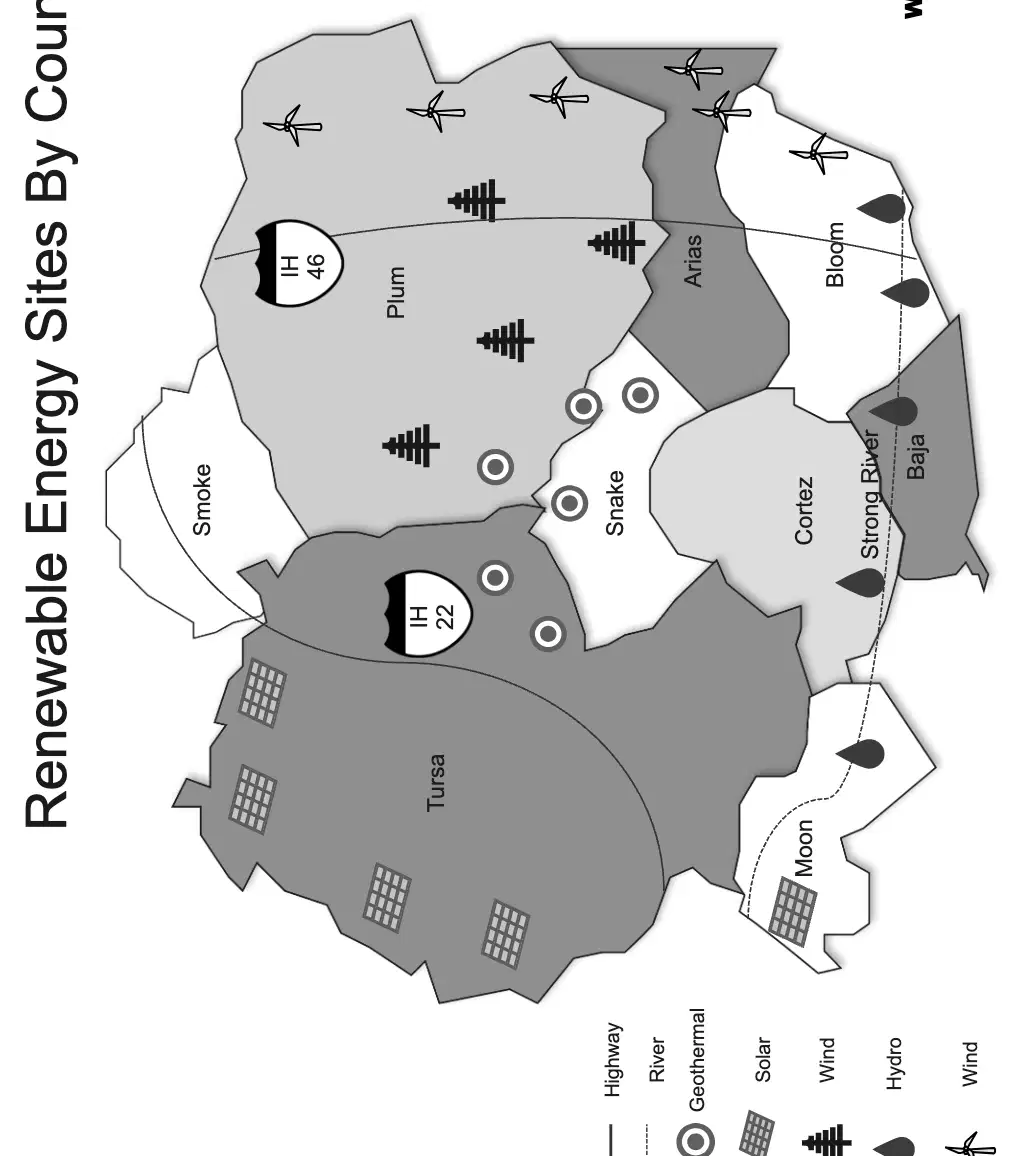
Match the following counties to the type of renewable energy site found there according to the map 'Renewable Energy Sites By County.'
Tursa
Solar
Plum
Geothermal
Strong River
Hydro
Snake
Geothermal
How many types of renewable energy are shown on the map?
1
3
5
7
Which of the following runs east to west?
IH 22
IH 46
Strong River
West River
How many solar energy sites are indicated on the map?
1
3
5
7
Which county has the greatest variety of energy producing sites?
Plum
Tursa
Cortez
Baja
Which of the following counties stretches the farthest north?
Baja
Moon
Snake
Bloom
How many counties have geothermal sites?
1
3
5
7
What type of energy site can be found across the most different counties?
Geothermal
Solar
Wind
Hydro
Which type of site produces the most energy?
Solar
Wind
Hydro
Not indicated on the map
How many types of energy sites are located in Smoke County?
0
1
2
3
Which county has the highest number of renewable energy sites?
Cortez
Tursa
Plum
Snake
All of the wind sites are located on the west edge of the map.
True
False
Both of the highways intersect the river.
True
False
All of the wood power sites are located in two counties.
True
False
According to the legend, one inch equals 5 miles on the map.
True
False
Bloom is the only country to have both a hydro and a wind site.
True
False

Based on the graph showing energy generated in terawatt hours from 2000 to 2020, which energy source generated the most energy in 2020?
Coal
Gas and Other Fossils
Hydropower
Nuclear
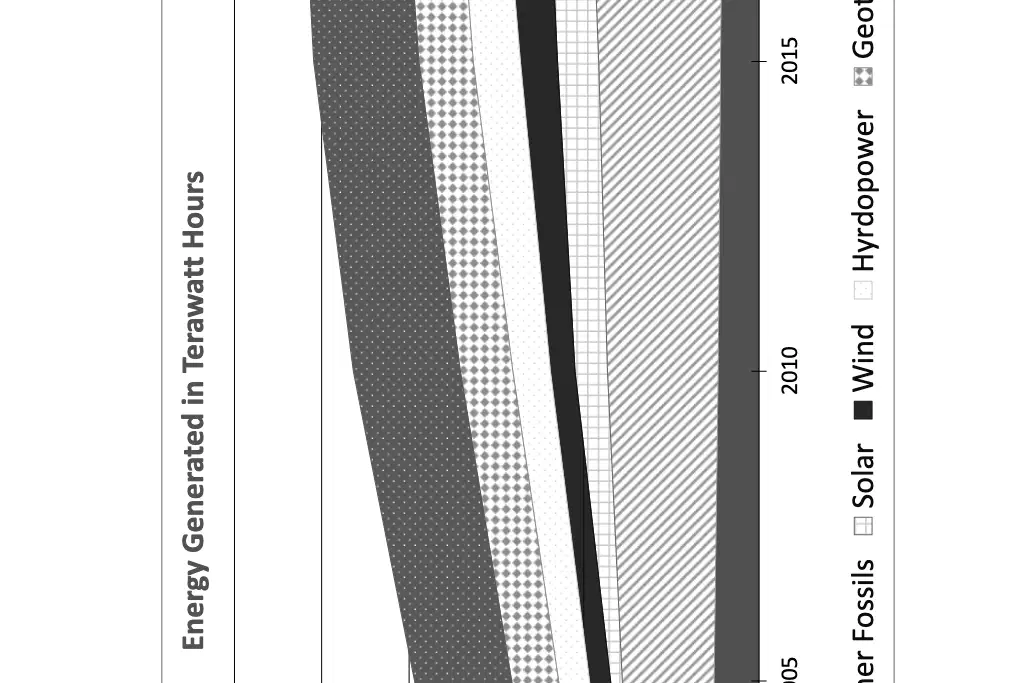
According to the graph, which renewable energy source showed the greatest increase in energy generation between 2000 and 2020?
Solar
Wind
Hydropower
Geothermal
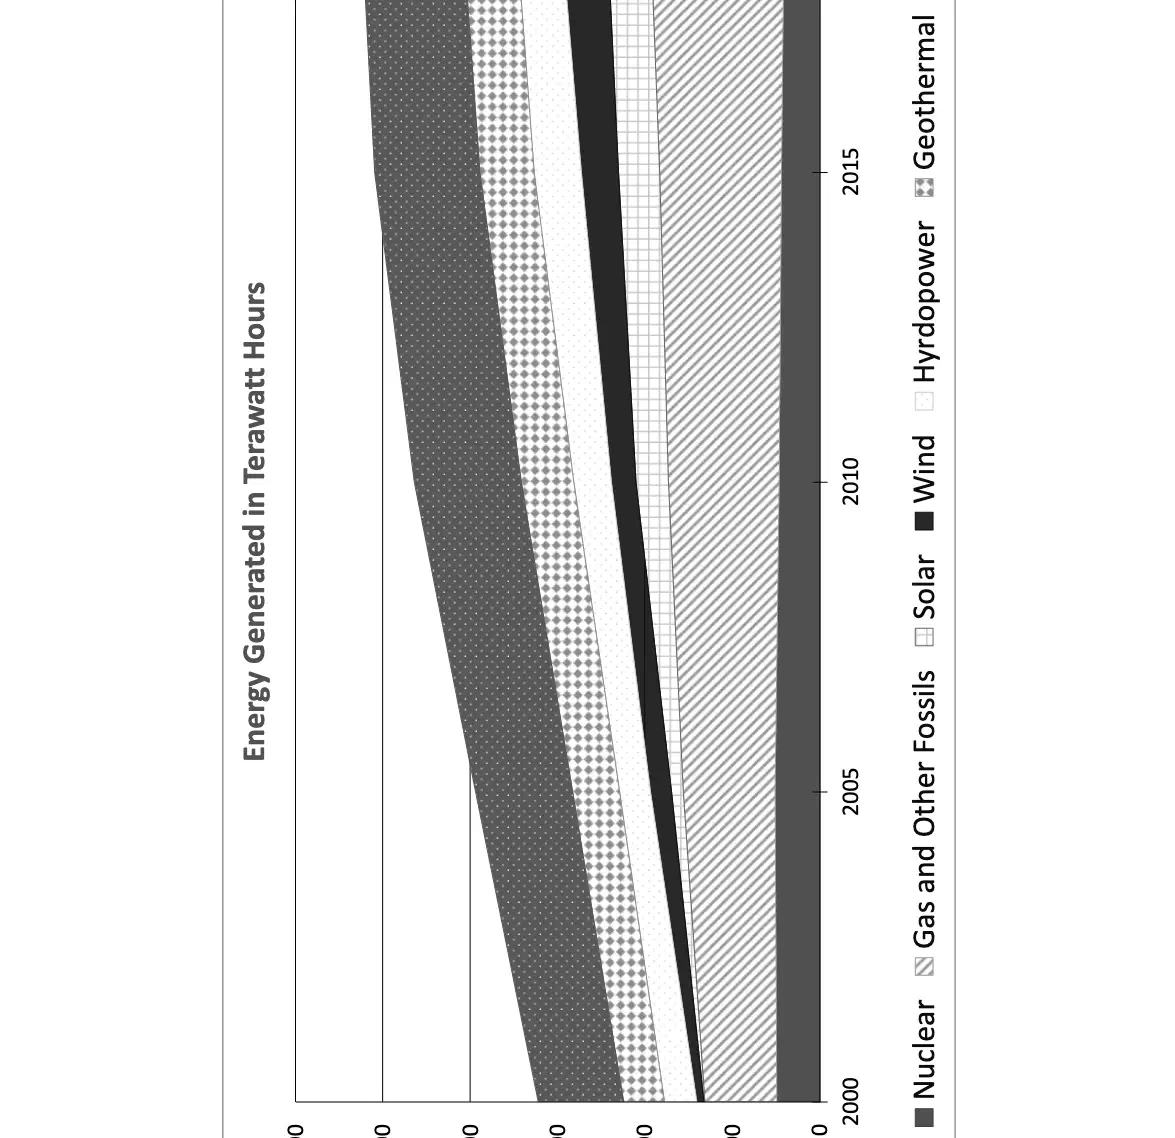
Fill in the blank: In 2000, the majority of energy was generated by ________ and ________ according to the graph.
Coal and Gas and Other Fossils
Nuclear and Hydro
Solar and Wind
Biomass and Geothermal
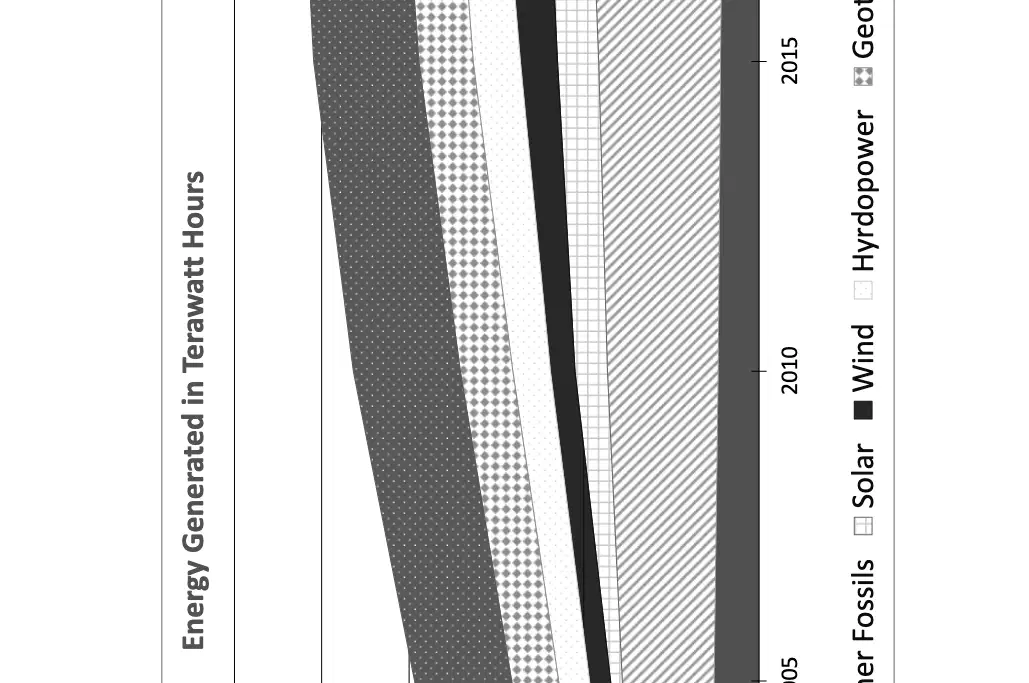
True or False: According to the graph, solar energy generation surpassed nuclear energy generation by 2020.
True
False

The graph shows the trend in coal energy generation from 2000 to 2020. What does the graph indicate?
Coal energy generation decreased steadily from 2000 to 2020.
Coal energy generation increased steadily from 2000 to 2020.
Coal energy generation remained constant from 2000 to 2020.
Coal energy generation fluctuated with no clear trend from 2000 to 2020.
How many categories of energy are included in the graph?
5
7
9
12
What does the x-axis represent?
Energy Type
The year
Total terawatt hours
None of the above
What span of time is covered by this graph?
5 years
10 years
15 years
20 years
In what year did coal output hit its peak?
2020
2015
2010
2005
Which type of energy had the most output in a single year?
Coal
Gas and Other Fossils
Nuclear
Geothermal
Energy for all categories combined was lowest in what year?
2020
2015
2010
2005
In 2000, what category of energy production had the least output?
Solar
Wind
Hydropower
Coal
How many categories of energy production had their highest output in 2020?
0
1
2
3
What does the darkest part of the graph represent?
2010
2020
Hydropower
Wind
In how many years did combined output exceed 15,000 terawatt hours?
0
1
3
5
Wind outproduced Solar every year.
True
False
Combined energy output peaked at 30,000 terawatt hours in a single year.
True
False
Solar in the only category that at least doubled in output in the time covered by the graph.
True
False
Gas and other fossils output increased every year.
True
False
Nuclear is the only category of energy production that had less output in 2020 than 2000.
True
False
The deepest lake on the continent is located in what country?
Russia
China
India
Philippines
What is the climate type across most of Russia?
Desert
Subarctic
Desert
Mediterranean
Which of the following Asian countries exports the most oil?
Kuwait
Russia
Iraq
United Arab Emirates
How far is it from the capital of Iran to the city of Qom, Iran?
About 25 miles
About 80 miles
About 130 miles
About 190 miles
Which of the following countries has the highest population per square mile?
China
Singapore
India
Russia
Semi-desert and desert land cover can be found in what country?
India
Japan
Borneo
None of the above
What is the most populous city in China?
Shanghai
Xining
Zibo
Aksu
What do the purple lines on the land cover map indicate?
Longitude lines
Continent borders
Country borders
None of the above
Which of the following countries is on the Tropic of Cancer?
Mongolia
Oman
Indonesia
None of the above
What country’s capital is located on the shores of the Persian Gulf?
Kazakhstan
Oman
Japan
None of the above
The Himalayas are shrinking about .2 inches per year.
True
False
Wetlands can be found in both southern and northern Asia.
True
False
During the winter the monsoon winds travel from north to south.
True
False
Hindu is the dominant religion in Nepal.
True
False
The population of Mysore, India is over 3,000,000.
True
False

According to the bar graph titled 'Cost of Energy Types (In Dollars) Per Megawatt Hour (2018-2022)', which energy type had the lowest cost per megawatt hour in 2022?
Hydro
Wind
Nuclear
Coal
Solar

Based on the bar graph titled 'Cost of Energy Types (In Dollars) Per Megawatt Hour (2018-2022)', in 2020, the cost of Solar energy was approximately:
80
60
100
120

According to the bar graph titled 'Cost of Energy Types (In Dollars) Per Megawatt Hour (2018-2022)', which energy type showed the most consistent cost from 2018 to 2022?
Hydro
Wind
Nuclear
Coal
Solar

Based on the bar graph titled 'Cost of Energy Types (In Dollars) Per Megawatt Hour (2018-2022)', True or False: The cost of Wind energy decreased every year from 2018 to 2022.
True
False

According to the bar graph titled 'Cost of Energy Types (In Dollars) Per Megawatt Hour (2018-2022)', match the following years to the energy type with the highest cost in that year:
Hydro
Solar
Wind
Solar
Nuclear
Solar
Coal
Solar
Solar
Solar
What is indicated on the y-axis?
Cost in dollars
Cost in energy
Type of energy
None of the above
What year was wind the most expensive?
2022
2021
2019
2018
Which type of energy dropped the most in cost from 2018 to 2022?
Wind
Nuclear
Coal
Solar
In what year did solar become less expensive than coal?
2018
2019
2020
2021
Which type of energy was the most expensive in the most years?
Solar
Coal
Nuclear
Hydro
In what year did coal reach its highest price?
2018
2019
2020
2021
Which of the following types of energy was the least expensive in 2020?
Wind
Nuclear
Coal
Solar
How many types of energy became less expensive every year?
0
1
2
3
What does the darkest column on the chart represent?
Dollars
Year
Coal
Solar
How many types of energy had their lowest price point in 2022?
0
1
3
4
The price of solar fluctuated the most over the amount of time covered in the chart.
True
False
The energy type with the highest cost for all years combined was coal.
True
False
Hydro was more expensive than wind every year.
True
False
The chart indicates how much each type of energy costs in dollars per gigawatt.
True
False
Solar was the most expensive energy source in the first year that is covered by the chart.
True
False
Which country is not part of the Great Rift Valley?
Ethiopia
Uganda
Tanzania
Senegal
The city of Casablanca is located in which country?
Morocco
Egypt
Algeria
Tunisia
The Sahara Desert is bordered by which mountain range to the north?
Atlas Mountains
Drakensberg Mountains
Marrah Mountains
Simien Mountains
Which country’s capital is the furthest north?
Chad
Sudan
Kenya
Zambia
Which of the following cities in Ghana has the largest population?
Kumasi
Wa
Tamale
Obuasi
The Cape of Good Hope is off the coast of what country?
Somalia
Senegal
Algeria
South Africa
Which of the following natural resources coincides with the Prime Meridian?
Coal
Natural Gas
Tin
Lead
What is the elevation of Mauritania’s coast?
Below sea level
0 to 500 feet
1,000 to 2,000 feet
2,000 to 5,000 feet

