
NEW
Font size
 Worksheets
Critical Points/Graph Behavior
Total questions: 40
Worksheet time: 8hrs 4mins
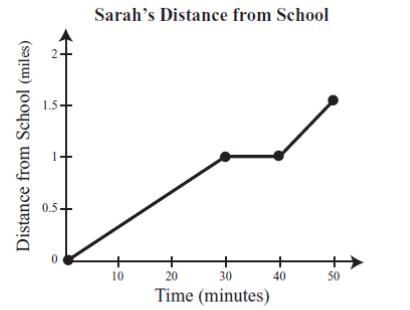
What is happening in the graph between 30 and 40 minutes?
Sarah is accelerating
Sarah is not moving
Sarah is slowing down
Sarah is travelling at a constant speed


Where is the entire graph decreasing?
The function is decreasing when x > –5.
The function is decreasing when x > –1.
The function is decreasing when x > 1.
The function is decreasing when x > 2.

What are all the intervals in which the function is decreasing?
The function is decreasing when x is between –5 and –3 and when x is between 7 and 10.
The function is decreasing when x is between 0.5 and 4 and when x is between 7 and 10.
The function is decreasing when x is between –5 and –3, when x is between 0.5 and 4, and when x is between 7 and 10.
The function is decreasing when x is between –7 and 2, when x is between –7 and 4.25, and when x is between –3.5 and –2.

Which interval of the function is linear?
x = –5 to x = 1
x = –1 to x = 7
x = 0 to x = 7
x = 1 to x = 7

For which values of x is y increasing the fastest?
between x = 0 and x = 1
between x = 1 and x = 3
between x = 3 and x = 4
between x = 6 and x = 7

Which statement describes all of the intervals where the function is increasing?
The function is increasing when x is between –1 and 2.0.
The function is increasing when x is between –7 and –4.
The function is increasing when x is between –7 and –4 and when x is between –1 and 2.
The function is increasing when x is between –10 and –7 and when x is between –4 and –1.

Which statement is true about the entire interval being described?
The graph is decreasing when x is between –6 and 8.
The graph is decreasing when x is between –2 and 2.
The graph is decreasing when x is between –6 and –2 and when x is between 2 and 8.
The graph is decreasing when x is between –5 and 1 and when x is between 1 and 5.

Which describes an interval that is decreasing?
between x = –2 and x = 3
between x = 0 and x = 3
between x = 0 and x = 5
between x = 3 and x = 5
An airplane takes off from an airport, flies at a steady height for a short period of time, then descends and lands back at the airport.
Which graph best represents this situation?


This graph shows Marc’s speed during his car trip.
What is happening between points N and O?
Marc’s car is traveling at a constant speed.
Marc’s car is stopped at a light.
Marc’s car is slowing down.
Marc’s car is speeding up.
Mr. Jones was driving on a highway at a constant speed. Which graph represents his speed and driving time?


Between which seconds is the height DECREASING?
Between 1 and 5.5 seconds

Is the highlighted section of this graph increasing, decreasing or no change?
increasing
decreasing
no change (stopped)

Is the highlighted section of the graph increasing, decreasing, or no change?
increasing
decreasing
no change (stopped)

These graphs show the motion of a car. Which graph shows the car's speed DECREASING?
graph A
graph B
graph C
graph D

This graph is decreasing on the intervals...
( -∞, -2 ) U ( 2, ∞ )
( -∞, 0 ) U ( 4, ∞ )
( -2, 2 )
( 0, 4 )

How many extrema are there in this graph?
1
2
3
4

How many of those extrema are maximums?
1
2
3
4

How many of the extrema are minimums?
1
2
3
4

How would you describe the point at (1,7)?
Relative Minimum
Absolute Minimum
Relative Maximum
Absolute Maximum

How would you describe the point at (0,6)?
Relative Minimum
Absolute Minimum
Relative Maximum
Absolute Maximum


How many turning points does the function have?
2
3
4
5

What type of extrema is x=2. Be as precise as possible.
minimum
global maximum
relative maximum
relative minimum


Where is the relative minimum on the graph?
(3, 2.5)
(13, 0.75)
(0, 1.75)
(.75, 2.5)
Where is the relative maximum on the graph?
(3, 2.5)
(13, 0.75)
(0, 1.75)
(.75, 2.5)

What is the maximum of the function?
(0,3)
(1,-4)
x=-1
(-1,4)
(4,-1)



