
Font size
 Worksheets
Unit 1 Linear Motion and Graph Test Review
Total questions: 27
Worksheet time: 20mins

How would you describe the motion and direction of the object in this distance vs time graph?
The object is moving at a constant speed away from the origin.
The object is accelerating.
The object is moving at a constant speed towards the origin.
The object is stationary.
A plane travels at an average speed of 600 kilometers per hour for 0.2 hours. How far does the plane travel? What formula do you need to use to solve this problem?
s = d/t
d = s x t
t = d/s
A plane travels at an average speed of 600 kilometers per hour for 0.2 hours. How far does the plane travel in that time?
120 km
3000 km
0.0003 km
300 km
If a car is traveling at an average speed of 60 kilometers per hour, how long does it take to travel 12,000 meters? (Convert m to km before calculating your answer.)
0.2 hour
0.5 hour
0.72 hour
5.0 hours
An object is uniformly accelerated from rest to a speed of 25 meters per second in 10 seconds. What is the acceleration of the object?
1.0 m/s^2
1.5 m/s^2
2.0 m/s^2
2.5 m/s^2
A car is accelerated at 4.0 m/s² from rest. How long does it take the car to reach a velocity of 28 meters per second?
3.5 s
7.0 s
14 s
24 s
A car is accelerated at 4.0 m/s² from rest. The car reaches a velocity of 28 m/s. What was the car's initial velocity?
0 m/s
4.0 m/s²
28 m/s
A car, starting from rest, accelerates at 4.0 m/s². What is the car's velocity at the end of 8.0 seconds?
0.50 m/s
2.0 m/s
16 m/s
32 m/s
A cart starting from rest travels a distance of 3.6 meters in 1.8 seconds. What is the cart's average speed?
0.20 m/s
0.50 m/s
2.0 m/s
5.0 m/s
A rocket reaches a final velocity of 200 m/s after 20 seconds with an acceleration of 8 m/s². What was its initial velocity at launch?
12 m/s
20 m/s
40 m/s
360 m/s
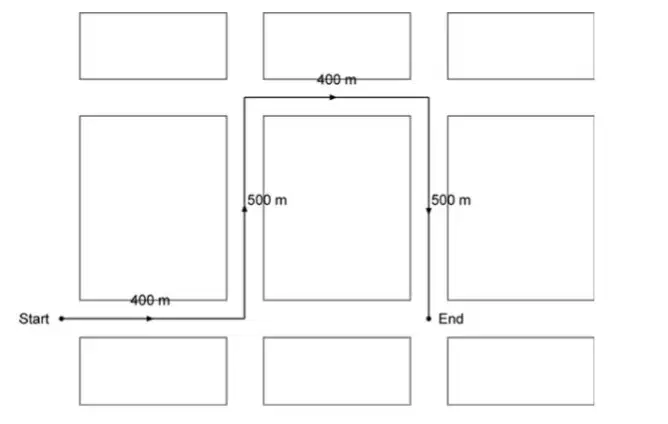
What is the magnitude of the total displacement of the school bus from the start to the end of its trip?
400 m
500 m
800 m
1800 m
What is the total distance travelled by the school bus from the start to the end of its trip?
400 m
500 m
800 m
1800 m
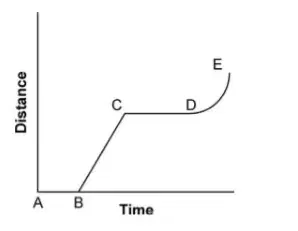
The graph below represents the relationship between the distance traveled and time elapsed for an object in motion. During which interval is the speed of the object changing?
AB
BC
CD
DE
The graph below represents the relationship between the distance traveled and time elapsed for an object in motion. During which interval is the object not moving?
AB
BC
CD
DE
The graph below represents the relationship between the distance traveled and time elapsed for an object in motion. During which interval is the object moving at a constant speed?
AB
BC
CD
DE
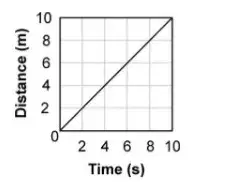
What is the average speed of the object?
1 m/s
4 m/s
6 m/s
8 m/s
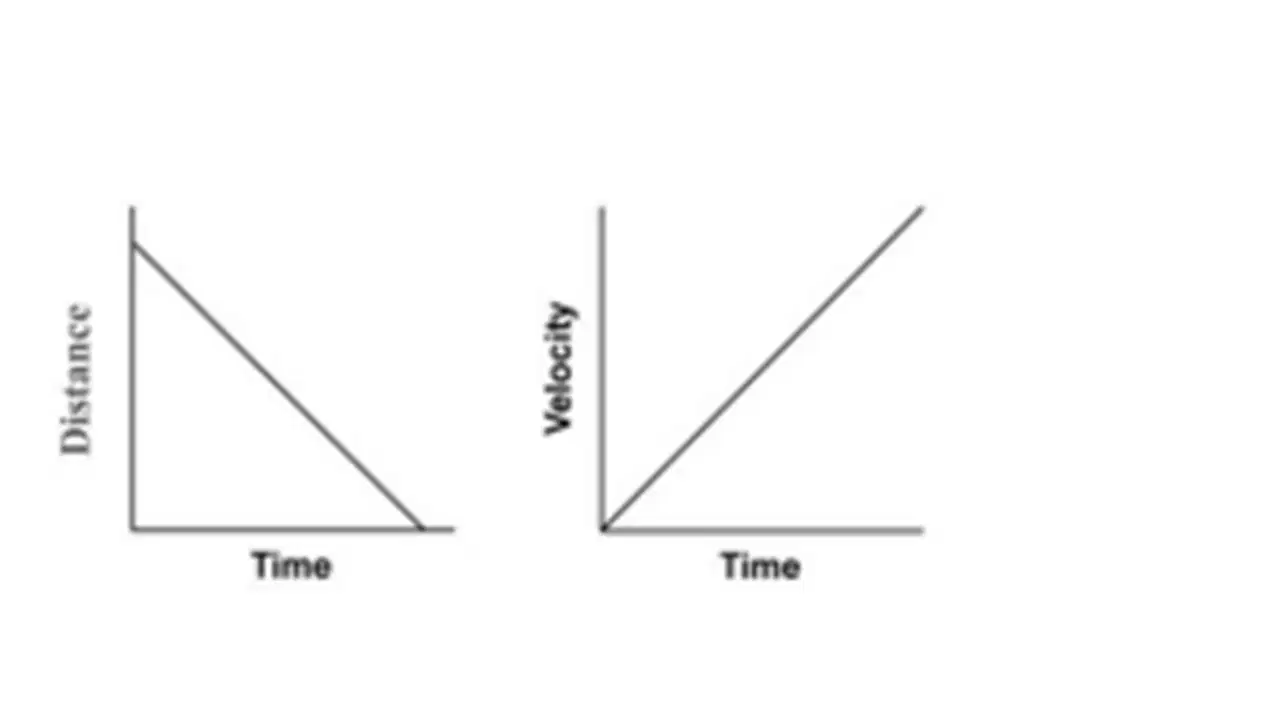
Which pair of graphs represents the same motion of an object?
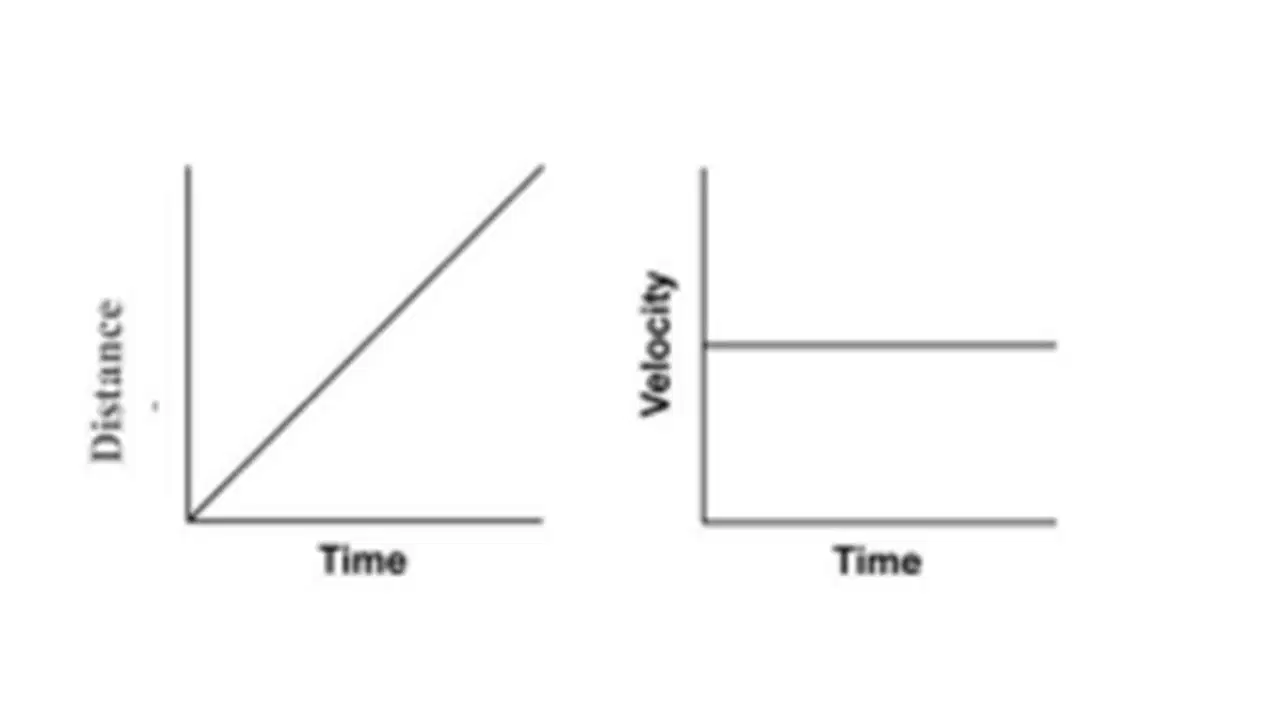
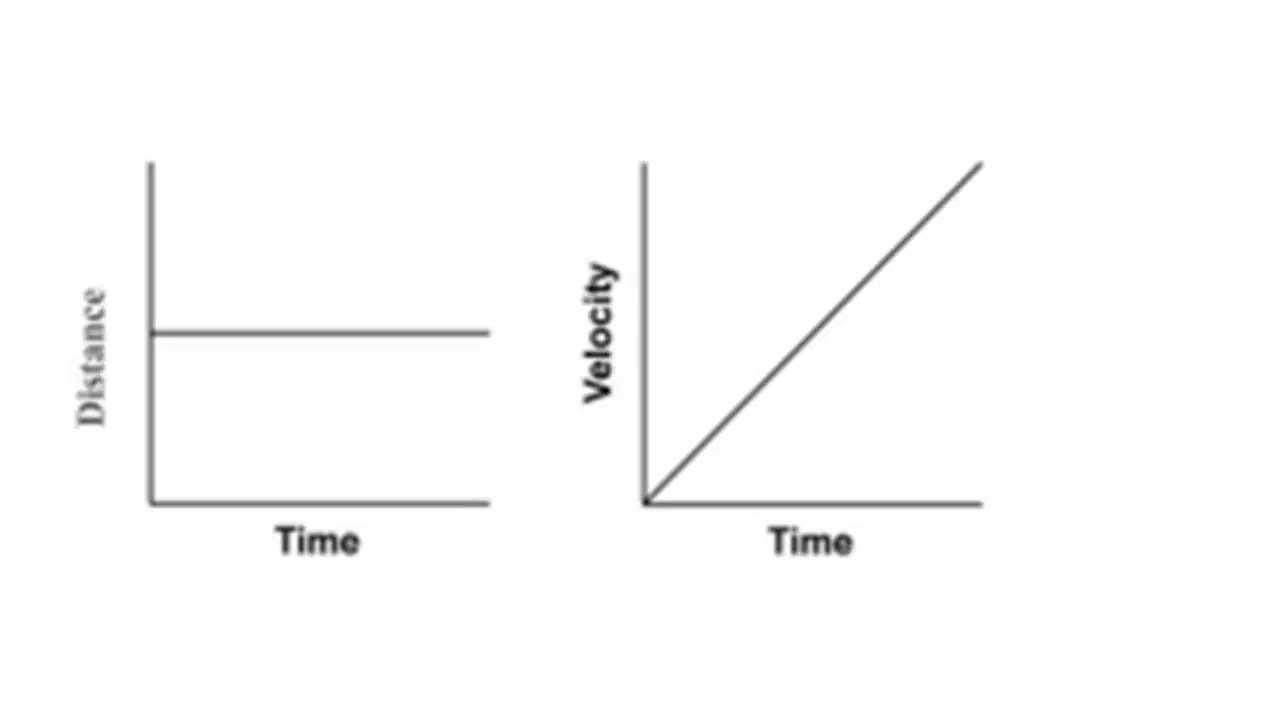
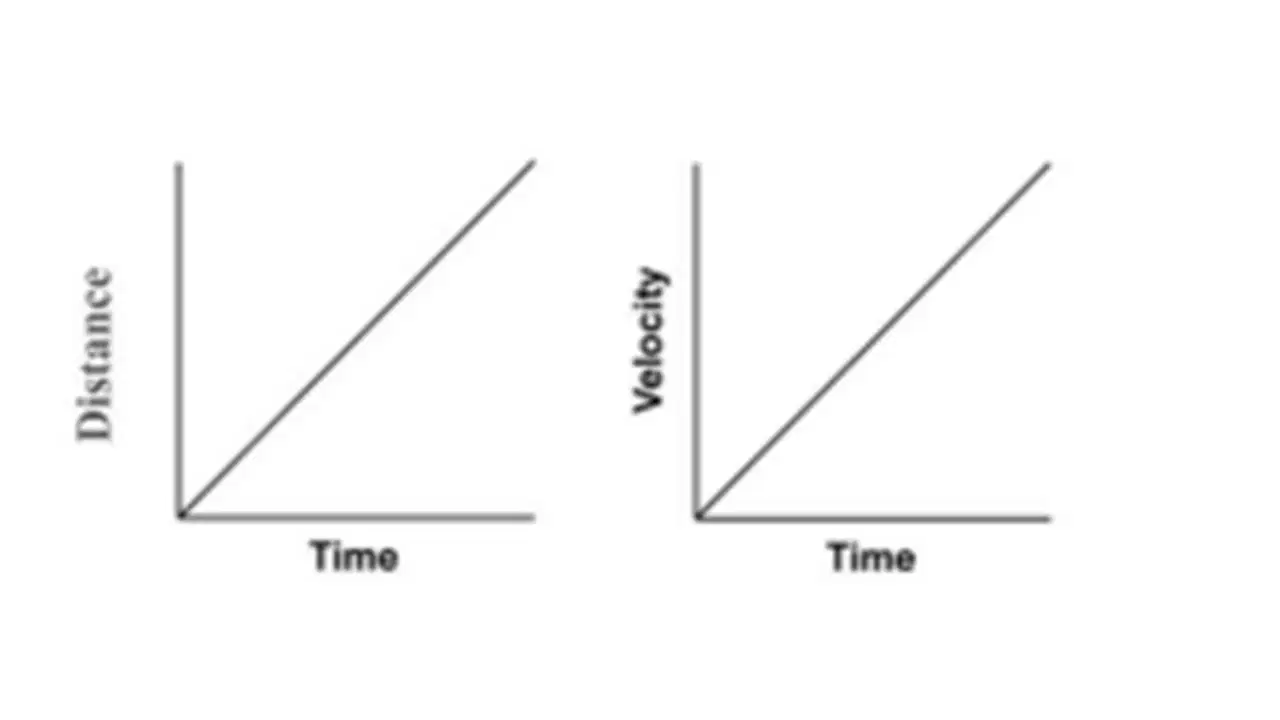
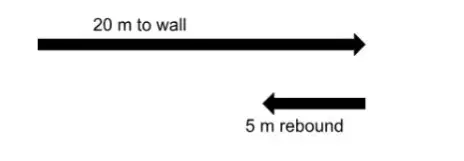
A tennis ball is hit by a tennis player and travels 20 meters to a wall. Then, the ball rebounds off the wall and travels 5.0 meters back toward the tennis player. What is the total distance travelled by the ball?
The total distance is 5.0 m
The total distance is 10 m
The total distance is 25 m
The total distance is 20 m
A tennis ball is hit by a tennis player and travels 20 meters to a wall. Then, the ball rebounds off the wall and travels 5.0 meters back toward the tennis player. What is the displacement of the ball?
The displacement is 5.0 m
The displacement is 15 m
The displacement is 25 m
The displacement is 20 m
A tennis ball is hit by a tennis player and travels 20 meters to a wall. Then, the ball rebounds off the wall and travels 5.0 meters back toward the tennis player. Compare the distance and displacement of the ball. Which statement below is correct?
The total distance is 5.0 m shorter than the displacement.
The total distance is 10 m shorter than the displacement.
The total distance is 5.0 m longer than the displacement.
The total distance is 10 m longer than the displacement.

The graph represents the motion of a body moving northward along a straight path.
Based on the graph, which quantity related to the motion of the body is constant?
The object is moving at a constant velocity
The object is accelerating at a constant rate
The object is decelerating
The object is at rest
Which pair of graphs represents the same motion of an object?
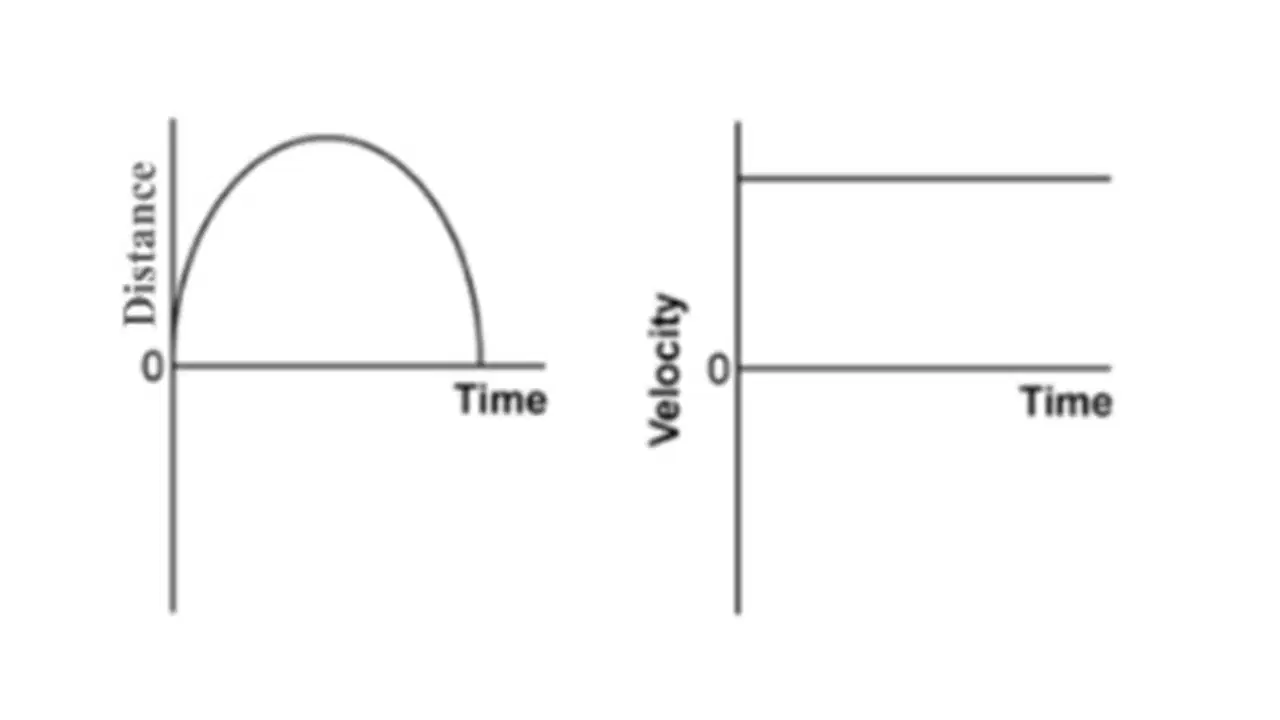
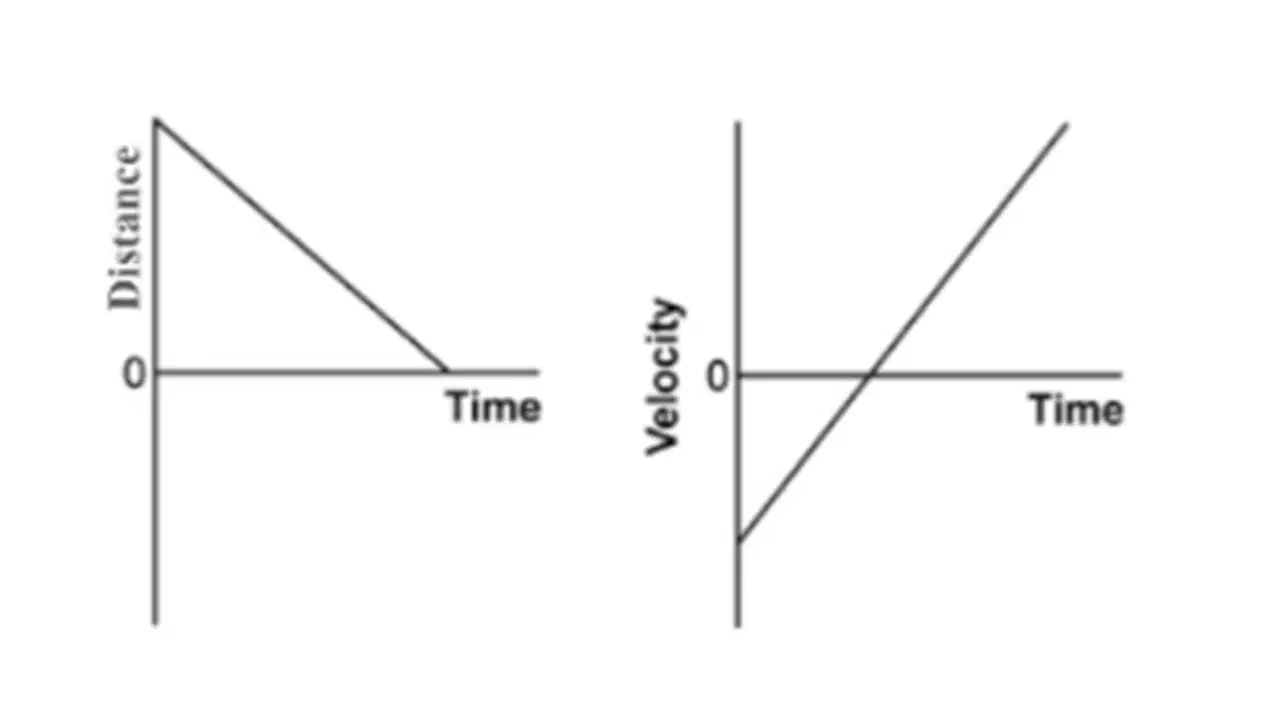
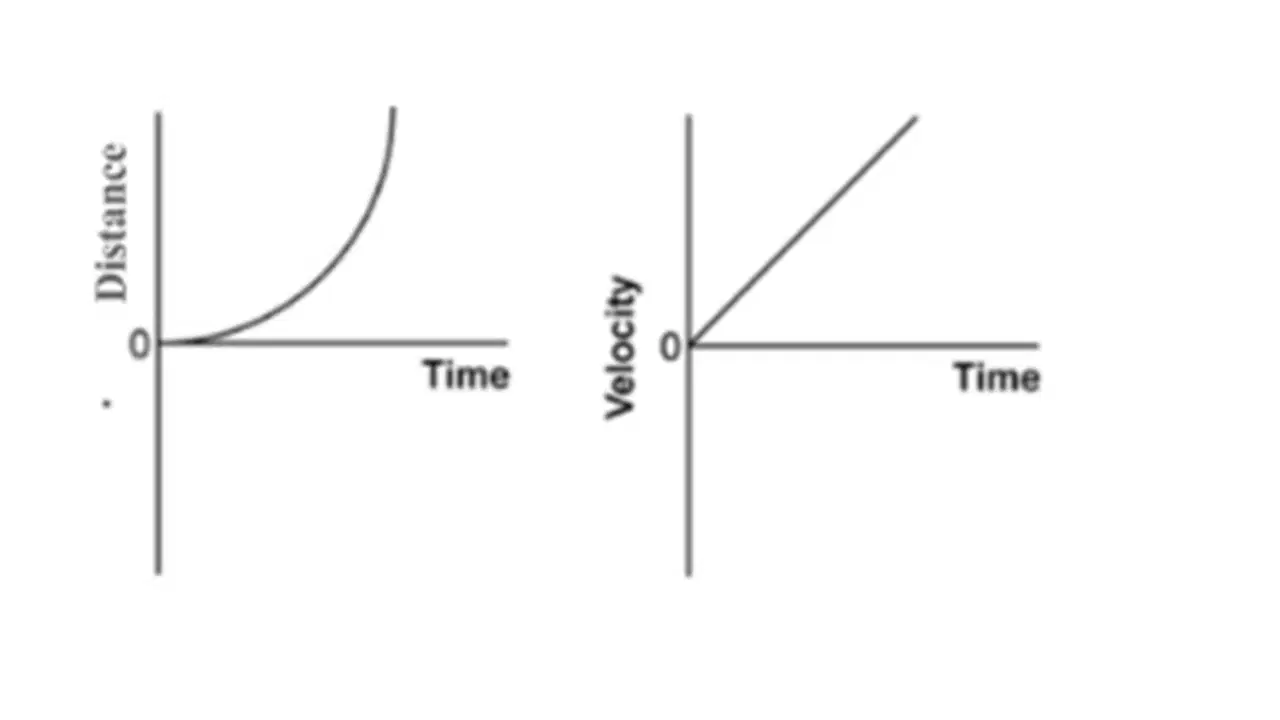

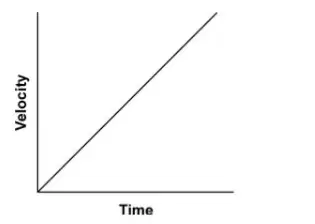
The graph below represents the motion of a body moving northward along a straight path. Based on the graph, which quantity related to the motion of the body is constant?
Velocity
Speed
Acceleration
Displacement
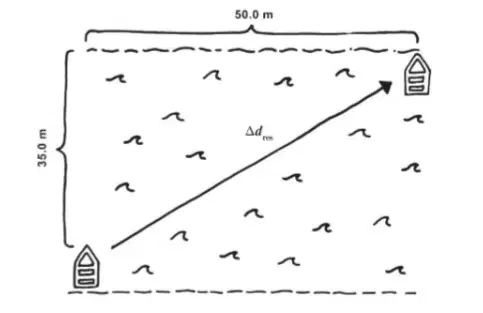
Starting from one shore, you row a boat across a narrow river to the shore on the other side. The river is 35.0 m wide. As you row, the river current causes your boat to move down the river a distance of 50.0 m. What is the displacement of your boat? (Use the Pythagorean Theorem.)
61.2
85.0
40.0
70.0

Select all of the available spots on the following Velocity vs. Time graph that represents an object at rest.
D, G
B, F
A, C, E, H

For the following graph, select the first TWO segments that represent the object traveling back towards home (negative direction).
B, D
D, F
B, F
For the following graph, select the first TWO segments that represent the object traveling away from home.
C,D
A,C
D,B

