
 Worksheets
Honors Chemistry Density Quiz
Total questions: 20
Worksheet time: 12mins

What is the mass of 200 cm³ of lead if its density is 11.34 g/mL?
2268 g
1134 g
500 g
4000 g
What is the volume of a block of aluminum with mass 40.5 g if the density of Al is 2.70 g/mL?
15.0 mL
10.0 mL
20.0 mL
25.0 mL
Density is the ratio of the mass of a material to its volume. It is a measure of how “packed in” matter is. D = m/V D = density; measured in g/ml or g/cm³ m = mass; measured in grams V = volume; measured in ml or cm³ Mercury metal is poured into a graduated cylinder that holds exactly 22.5 mL. The mercury used to fill the cylinder weighs 306.0 g. From this information, calculate the density of mercury.
13.6 g/mL
0.0735 g/mL
7.35 g/mL
1.36 g/mL
What is the mass of ethyl alcohol that exactly fills a 200.0 mL container? The density of ethyl alcohol is 0.789 g/mL.
157.8 g
178.0 g
126.5 g
200.0 g
A golden-colored cube is handed to you. The person wants you to buy it for $100, saying that is a gold nugget. You pull out your old geology text and look up gold in the mineral table, and read that its density is 19.3 g/cm³. You measure the cube and find that it is 2 cm on each side, and weighs 40 g. What is its density? Is it gold? Should you buy it?
Density = 5 g/cm³. It is not gold. You should not buy it.
Density = 10 g/cm³. It is gold. You should buy it.
Density = 19.3 g/cm³. It is gold. You should buy it.
Density = 20 g/cm³. It is not gold. You should not buy it.
Ice floats in water but steel sinks because of differences in density. How does a ship like the Titanic float in the ocean?
Because the ship's overall density is less than water due to the air inside it
Because steel is lighter than water
Because the ship is moving fast
Because the ocean is saltier than freshwater

What is the correct way to graph the measured data for iron from Table 1, with volume on the x-axis and mass on the y-axis?
Plot volume (cm³) on the x-axis and mass (g) on the y-axis for each trial's data point.
Plot mass (g) on the x-axis and volume (cm³) on the y-axis for each trial's data point.
Plot both mass and volume on the y-axis for each trial's data point.
Plot both mass and volume on the x-axis for each trial's data point.

What is the slope (rise over run) of the graph? Show your work on the graph.
The slope is approximately 7.6 g/cm³ (using two points: (5.0, 38.00) and (0, 0): (38.00-0)/(5.0-0) = 7.6).
The slope is approximately 5.0 g/cm³ (using two points: (5.0, 38.00) and (0, 0): (5.0-0)/(38.00-0) = 0.13).
The slope is approximately 38.0 g/cm³ (using two points: (5.0, 38.00) and (0, 0): (38.00-0)/(1.0-0) = 38.0).
The slope is approximately 1.3 g/cm³ (using two points: (5.0, 38.00) and (0, 0): (38.00-0)/(30.0-0) = 1.3).

What is the experimentally determined density of iron?
The experimentally determined density of iron is approximately 7.6 g/cm³.
The experimentally determined density of iron is approximately 2.7 g/cm³.
The experimentally determined density of iron is approximately 1.0 g/cm³.
The experimentally determined density of iron is approximately 19.3 g/cm³.
The accepted density of iron is 7.87g/cm³. Use the experimentally determined density from your graph and the accepted density of iron to calculate the percent error of your result.
Percent error = [(experimental density - 7.87) / 7.87] × 100
Percent error = [(7.87 - experimental density) / experimental density] × 100
Percent error = [(experimental density + 7.87) / 7.87] × 100
Percent error = [(7.87 + experimental density) / experimental density] × 100
Copper has a density of 8.96 g/mL. If a penny is solid copper (it isn't) and has a mass of 3.2 grams, what volume does the penny have?
0.36 mL
2.8 mL
5.8 mL
12 mL
Find the mass of a container that has a volume of
380 cm3 and a density of 0.97 g/cm3.
368.6 g
0.0026 g
391.8 g
None of these
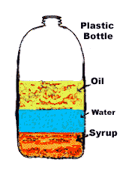
Which liquid is the least dense?
oil
water
syrup
none; the densities are equal

Which box has a lower density?
Box A
Box B
cannot be determined
they are the same

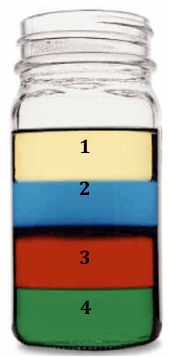
Put the liquids in order from most dense to least dense.
4, 3, 2, 1
1, 2, 3, 4
3, 4, 2, 1,
4, 3, 1, 2

I have two objects with the same volume but different masses. Which object will be more dense?
The object with less weight.
The object with more weight.
The object with more mass.
The object with less mass.
If a a liquid has a density of 3 g/mL and a mass of 9 g. What is the volume? Use the density triangle to solve the problem
24 mL
18 mL
3 mL
12 mL

