
 Worksheets
Gravity and Magnetism Graphs Worksheet
Total questions: 10
Worksheet time: 5mins

What is on the x-axis of Graph 1 (Gravity vs. Distance)?
Distance between objects (m)
Gravitational Force (N)
Number of paperclips held
Time (s)

At a distance of 2 meters, approximately how strong is the gravitational force according to Graph 1?
66N
25N
4N
20N

As the distance between objects increases, what happens to the gravitational force?
It increases
It stays the same
It decreases
It fluctuates randomly

What is on the y-axis of Graph 2 (Magnet Strength vs. Distance)?
Distance between magnet and paperclip (cm)
Number of paperclips held
Gravitational Force (N)
Time (s)

What is the relationship between distance and magnetism as shown in Graph 2?
As distance increases, magnetism increases
As distance increases, magnetism decreases
As distance increases, magnetism stays the same
There is no relationship
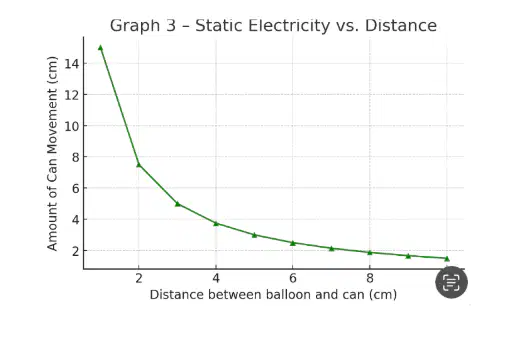
What is on the x-axis of the graph shown in the experiment?
Distance between balloon and can (cm)
Amount of can movement (cm)
Time (seconds)
Temperature (°C)
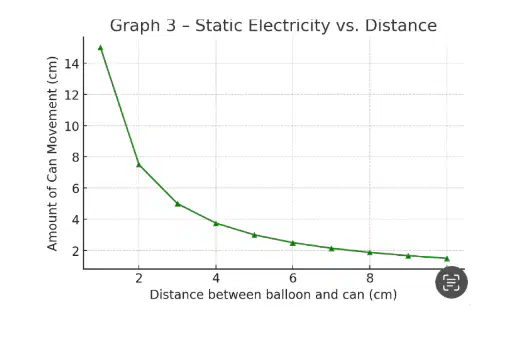
What is on the y-axis of the graph shown in the experiment?
Amount of can movement (cm)
Distance between balloon and can (cm)
Time (seconds)
Mass of the can (g)

When the balloon was 2 cm away from the can, approximately how much can movement was there?
12 cm
7.5 cm
4 cm
2 cm

When the balloon was 8 cm away from the can, approximately how much can movement was there?
2 cm
4 cm
8 cm
12 cm

As the distance between the balloon and the can increased, what happened to the amount of movement from the can?
The amount of movement decreased
The amount of movement increased
The amount of movement stayed the same
The amount of movement doubled

