wayground logo

Free Printable Worksheets

NEW

Font size

S
M
L
XL
Worksheets

Bar Graphs

Total questions: 45

Worksheet time: 2hrs 16mins

Name
Class
Date
1.

How many apples were there?

a)

1

b)

2

c)

3

d)

4

2.

Which animal did kids like most?

a)

cat

b)

dog

c)

rabbit

3.

Which sport did kids like most?

a)

Soccer

b)

Softball

c)

Basketball

d)

Other

4.

Look at the bar graph, "Nicest Fruit". What does the x-axis show?

a)

Types of fruit

b)

The number of people.

5.

Look at the bar graph, "Nicest Fruit". What does the y-axis show?

a)

Types of fruit

b)

Number of people.

6.

Look at the Bar Graph "Student Grades". Which grade did the smallest number of students get?

a)

A

b)

B

c)

C

d)

D

7.
How many students' favorite color is blue?
a)
11
b)
12
c)
14
d)
17
8.
a)

Ginger Snap

b)

Oatmeal Cookie

c)

Sugar Cookie

9.
How many more people like red than purple?
a)
100
b)
10
c)
2
d)
5
10.
How many people voted for red as their favorite color?
a)
100
b)
2
c)
4
d)
9
11.

Which cereal was most popular?

a)

Corn Flakes

b)

Cheerios

c)

Life

d)

Kix

12.

How many more boys picked basketball than girls?

a)

1

b)

4

c)

5

d)

6

13.

How many students were surveyed in all?

a)

21

b)

17

c)

22

d)

23

14.

How many more students picked fruit than crackers and popcorn?

a)

2

b)

5

c)

7

d)

9

15.

How many more red and orange M&Ms were in the bag than yellow?

a)

35

b)

30

c)

25

d)

20

16.

Look at the Bar Graph "Student Grades". Which grade did the smallest number of students get?

a)

A

b)

B

c)

C

d)

D

17.
How many votes did reading and social studies receive together?
a)
9
b)
11
c)
13
d)
15
18.

How many chickens does Nate have on his farm?

a)

11

b)

12

c)

9

d)

10

19.
How many students like hockey and football?
a)
21
b)
3
c)
12
d)
9
20.
How many students voted for their favorite sport?
a)
38
b)
17
c)
40
d)
50
21.
What type of graph is this?
a)
bar graph
b)
pictograph
c)
tally chart
22.
How many more people like the color purple than blue?
a)
1
b)
3
c)
6
d)
8
23.
How many days were either rainy or partly cloudy?
a)
8
b)
5
c)
3
d)
7
24.

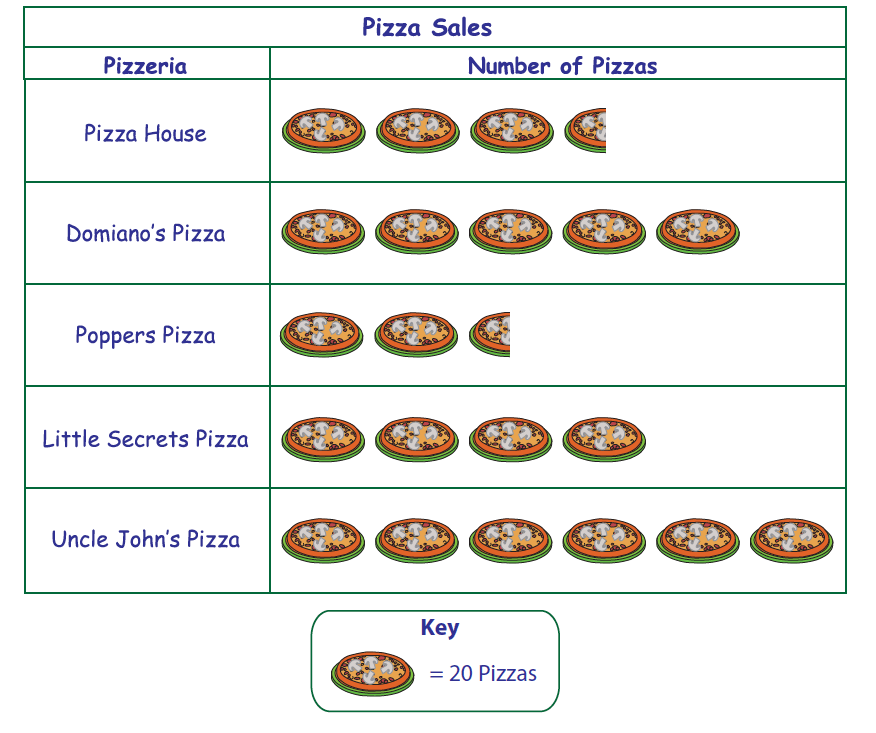
How many pizzas were sold by Peppers Pizza?

a)

50

b)

3

c)

30

d)

2 and a half

25.

How many strawberries does Ed have?

a)

2

b)

20

c)

6

d)

4

26.
a)

Ginger Snap

b)

Oatmeal Cookie

c)

Sugar Cookie

27.
How many students take the bus to school?
a)
35
b)
20
c)
10
d)
15
28.
How many more people like red than purple?
a)
100
b)
10
c)
2
d)
5
29.

Look at the Bar Graph "Student Grades". Which grade did the smallest number of students get?

a)

A

b)

B

c)

C

d)

D

30.
How many more people like red than purple?
a)
100
b)
10
c)
2
d)
5
31.
How many people voted for red as their favorite color?
a)
100
b)
2
c)
4
d)
9
32.

How many chickens does Nate have on his farm?

a)

11

b)

12

c)

9

d)

10

33.
How many students like hockey and football?
a)
21
b)
3
c)
12
d)
9
34.
How many students voted for their favorite sport?
a)
38
b)
17
c)
40
d)
50
35.
a)

Ginger Snap

b)

Oatmeal Cookie

c)

Sugar Cookie

36.
a)

2

b)

5

c)

3

37.
a)

2

b)

3

c)

1

38.
a)

9

b)

10

c)

8

39.
a)

2

b)

3

c)

1

40.
a)

4

b)

1

c)

3

41.
a)

7

b)

4

c)

1

42.
How many people like soccer best?
a)
5
b)
4
c)
8
d)
6
43.

How many horses does Nate have on his farm?

a)

4

b)

3

c)

2

d)

5

44.

The graph shows how employees at Disney World travel to work. How many employees ride bikes, ride the bus, or walk to work?

a)

300

b)

450

c)

325

d)

375

45.
How many people like soccer best?
a)
5
b)
4
c)
8
d)
6