
 Worksheets
Lesson 15 Assessment
Total questions: 21
Worksheet time: 10mins
Name
Class
Date
1.
What do we call the study of human populations and how they change?
a)
biodiversity
b)
demography
c)
life expectancy
d)
human geography
2.
Which of these statements is most likely true of a European country with a replacement rate under 2.0?
a)
Its population is growing older.
b)
Its population is growing poorer.
c)
Its population is growing very rapidly.
d)
Its population is growing more diverse.
3.
Which of these best describes population changes in Europe since 2000?
a)
brain drain
b)
rural decline
c)
urban sprawl
d)
negative growth
4.
Italy has a total fertility rate of just over 1. Nigeria has a total fertility rate of more than 5. Which of these conclusions can be drawn from these facts?
a)
Italy has a larger population than Nigeria.
b)
Nigeria has a younger population than Italy.
c)
Men in Italy retire later than men in Nigeria.
d)
Women in Nigeria live longer than women in Italy.
5.
A country with an aging population is most likely to face rapidly rising costs for which of the following?
a)
refugees
b)
pensions
c)
pollution
d)
unemployment
6.
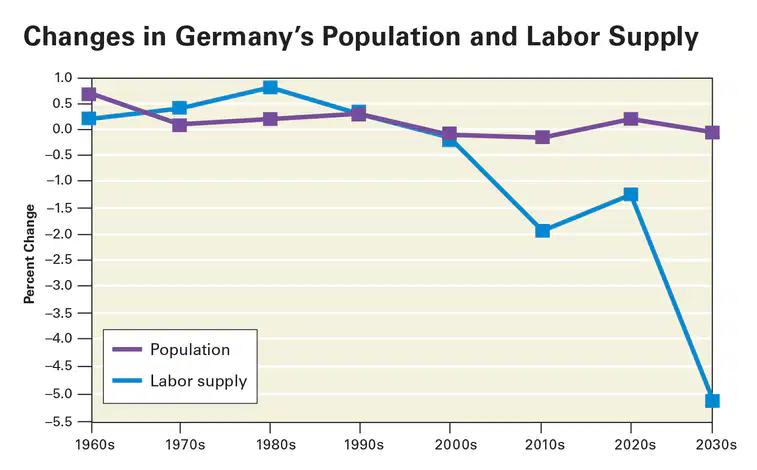
According to this graph, in which decade did Germany’s labor supply begin to decline?
a)
1960s
b)
1970s
c)
1980s
d)
1990s
7.
Life expectancy is a measure of which of the following in a population?
a)
the average age at which people die
b)
the average age at which people retire
c)
the average age at which people become parents
d)
the average age at which people enter the workforce
8.
Cash incentives for larger families, raising retirement ages, and family-friendly workplace policies are all responses to Europe’s declining
a)
birth rates.
b)
living standards.
c)
life expectancies.
d)
migration streams.
9.
What is a total fertility rate?
a)
the number of old and young dependents who do not work compared with the working-age population
b)
the study of how human populations change due to births, deaths, aging, and migration
c)
the average age that a person in a given population can expect to live to
d)
the average number of children a woman in a given population will have in her lifetime
10.
Which is not a cause of low total fertility rates in Europe?
a)
Women delay having children to pursue education and careers.
b)
Low costs of living in Europe allow young couples to support large families easily.
c)
Older women tend to have fewer children.
d)
Access to family planning allows women to control the number of children they have.
11.

In recent years, Europe’s elderly population has
a)
shrunk.
b)
grown.
c)
remained the same.
d)
migrated to other continents.
12.
What is a dependency ratio?
a)
the number of old and young dependents who do not work compared with the working-age population
b)
the study of how human populations change due to births, deaths, aging, and migration
c)
the average age that a person in a given population can expect to live to
d)
the average number of children a woman in a given population will have in her lifetime
13.
How can aging societies address the problems they face?
a)
by reducing access to healthcare
b)
by lowering the retirement age
c)
by raising the retirement age
d)
by lowering the birthrate
14.
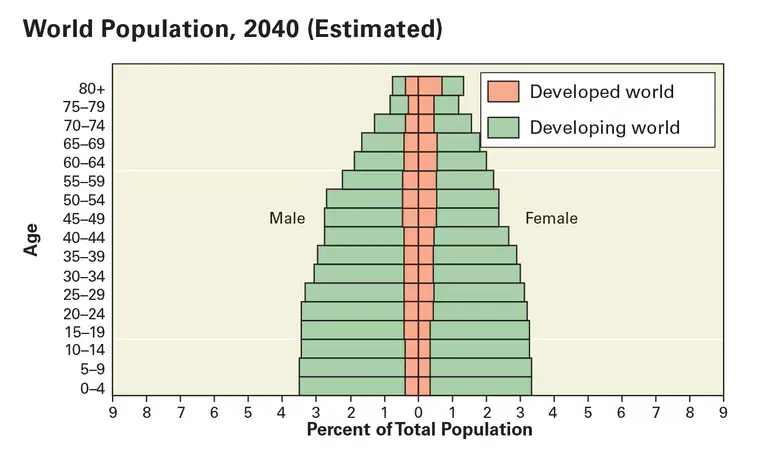
By 2040, will a larger percentage of the world’s population live in developed countries or developing countries?
a)
Developed
b)
Developing
15.
Do developing or developed countries have higher birth rates?
a)
Developed
b)
Developing
16.

The four widest bars on the graphs represent the baby boomer group. Looking at the 2017 graph, what is the age group of the baby boomers in 2017?
a)
0-14 years old
b)
15-34 years old
c)
35-54 years old
d)
55-80 years old
17.

In 2017, the baby boomer group is probably
a)
in school.
b)
in the workforce.
c)
retired.
18.
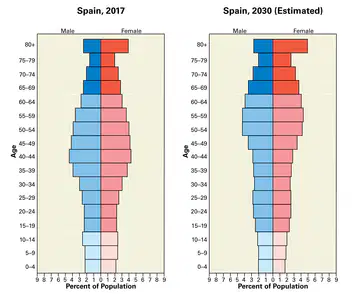
Looking at the 2030 graph, what is the age group of the baby boomers in 2030?
a)
0-14 years old
b)
15-34 years old
c)
35-54 years old
d)
50-69 years old
e)
70-80 years old
19.
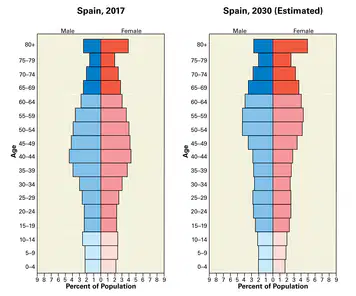
In 2030, the baby boomer group is probably made up of
a)
retirees only.
b)
people in the workforce only.
c)
some retirees and some still in the workforce.
d)
poeple in school.
20.

What happened to the U.S. population between 1960 and 2000?
a)
It stayed the same.
b)
It grew by about 100,000.
c)
It grew by about two million.
d)
It grew by about 100 million.
21.

This population pyramid shows...
a)
Rapid growth
b)
Slow growth
c)
Negative growth
100 %

