
 Worksheets
Statistical Inferences about Two Means — Worksheet Extraction
Total questions: 10
Worksheet time: 5mins
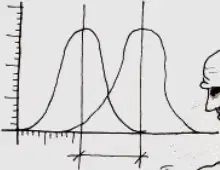
What is the primary goal when comparing two populations in this context?
Determine whether there is a significant difference between the two population means
Compute the median for each population and compare visually
Estimate the variance of a single population
Construct a confidence interval for one population proportion
In the same context of comparing average salaries of marketing and production managers, choose the rearranged form that is equivalent to the null hypothesis.
μM−μP=0
μM−μP=0
μM+μP=0
μP−μM=1

Independent samples are selected from the two populations with sample sizes shown. What are the sample sizes for the two groups used in this analysis?
n1 = 50, n2 = 50
n1 = 100, n2 = 100
n1 = 75, n2 = 125
n1 = 120, n2 = 80
Compute the point estimate of the difference in population means using the given sample means. Given xˉ1=34.5 and xˉ2=42.4 , what is xˉ1−xˉ2 ?
−7.9
7.9
−77.9
−3.9
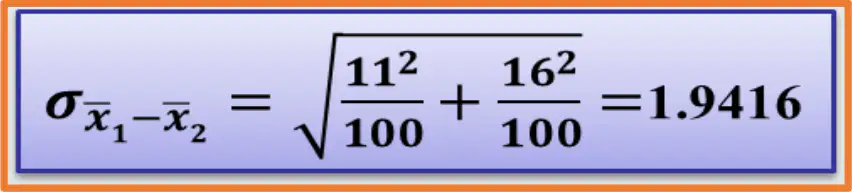
Determine the standard error for the difference in sample means using the displayed formula and values. Using σxˉ1−xˉ2=100112+100162 , what is the standard error?
1.4142
1.6449
1.9416
2.5750
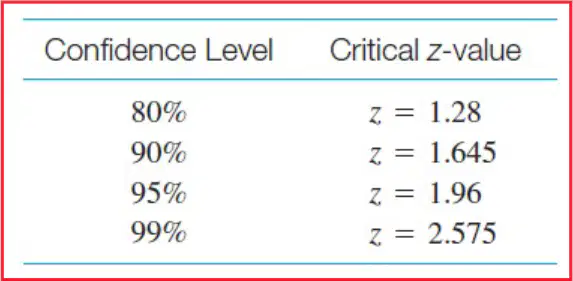
Identify the critical value shown for the stated confidence level. For a 95% confidence interval, what z-value is used?
1.28
1.645
1.96
2.575

A major bank wishes to develop a 95% confidence interval estimate for the difference in population means for spending by unmarried versus married card holders, and they do not believe the population standard deviations are equal. Which procedure should be used to construct the interval for μ1−μ2 ?
Two-sample t interval with unequal variances (Welch’s method)
Two-sample pooled t interval assuming equal variances
Two-sample z interval with known population standard deviations
One-sample t interval for a single mean
Based on the calculations shown, what is the 95% confidence interval for μ1−μ2 (unmarried minus married)?
137.53 to 234.87
118.25 to 254.15
106.90 to 265.50
120.00 to 240.00
What is the observed difference in sample means used in the interval calculation for xˉ1−xˉ2 ?
186.20
137.53
234.87
48.67

According to the sample summary presented, which group has the higher mean spending?
Unmarried customers
Married customers

