
 Worksheets
Year 6 - Introduction to Spreadsheets - Raspberry Pi
Total questions: 11
Worksheet time: 6mins
Which of these statements are true about spreadsheets? (Tick all that apply)
When using formulas with cell references, changing one cell can change another
Calculations can be used on any data type in a spreadsheet
Data can be calculated using different operations within the spreadsheet
Charts can be produced using the data held in spreadsheets
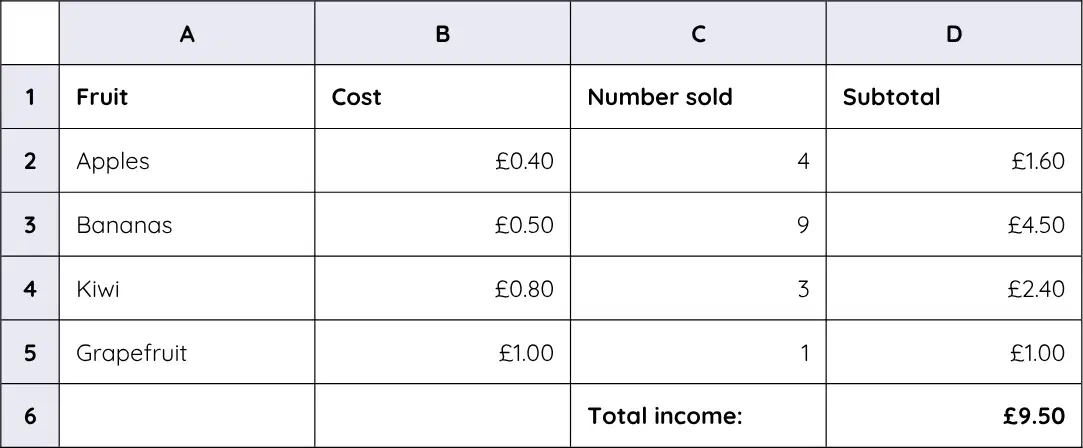
Below is an example section of a spreadsheet. How much does one kiwi cost?
£3
£9.50
£0.80
£2.40
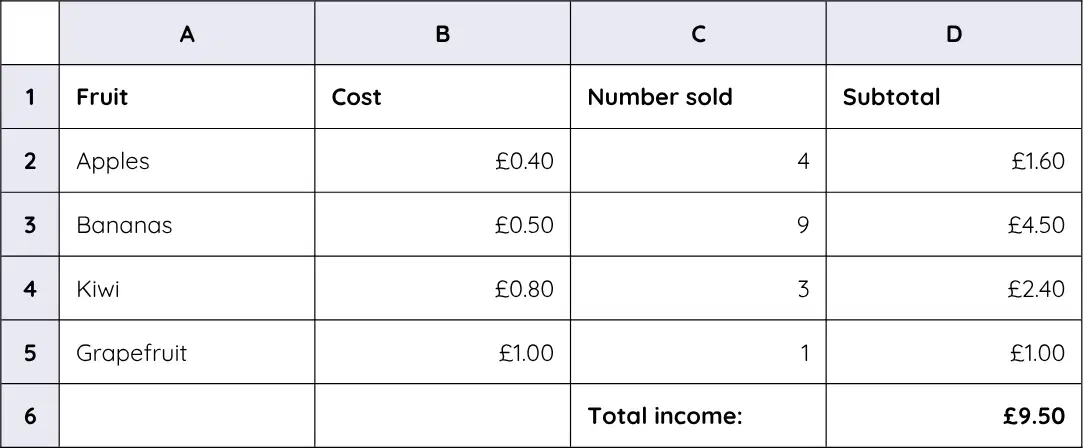
Which of the following is the correct cell reference for the subtotal of grapefruit?
D5
A5
£1.00
D1
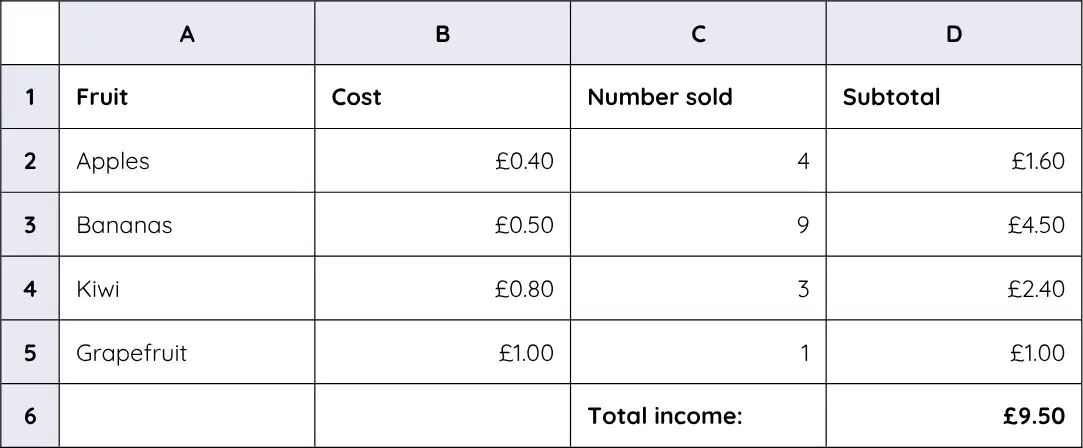
Which formula is the correct formula to calculate the subtotal for bananas?
=B3xC3
=B3*C3
=C3*D3
=C3xD3
What does this operator mean in a spreadsheet / ?
Divide
Multiply
Add
Subtract
Which of these would make suitable column headings in a spreadsheet for a local supermarket? (Tick all that apply)
Cost
£4.62
Apples
Item
Which number format has been applied to this piece of data? 12:05:00
Date
Italics
Duration
Currency
What does this SUM function calculate? =SUM(A1:A4)
The total cost of items
The total of A1, A2, A3, and A4
The total of A1 and A4
A data heading
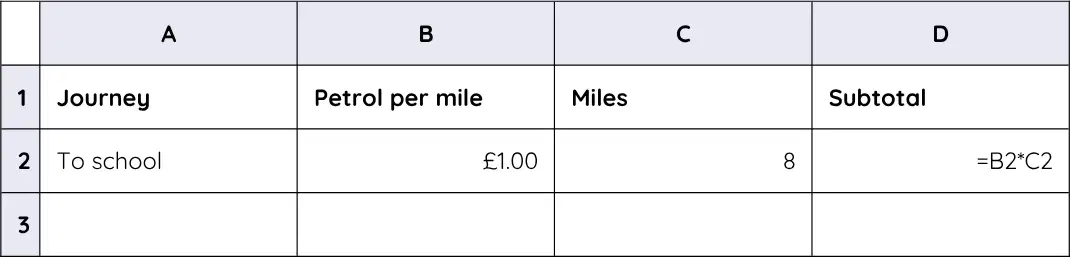
The subtotal column in the spreadsheet section has been calculated using a formula. Which cell could be changed to alter the value shown in D2? The spreadsheet shows columns A Journey, B Petrol per mile (B2 £1.00), C Miles (C2 8), and D Subtotal with D2 displaying =B2*C2.
A2
B2
£8.00
D1
Some children want to show the head teacher how much cheaper the school heating bill would be if the doors were left closed at playtime. Should they show their data in a spreadsheet table or a graph?
Spreadsheet table
Graph
For the situation about showing how much cheaper the school heating bill would be if doors were left closed at playtime, why is your chosen method the best way to present the data to the head teacher?
A graph makes it easy to compare savings visually and spot trends
A spreadsheet table hides differences and is harder to read quickly
A graph removes the need to collect any numbers
A spreadsheet table is the only way to present information to a head teacher

