
NEW
Font size
 Worksheets
Scatter Plots/Line of Best Fit
Total questions: 61
Worksheet time: 2hrs 8mins

What kind of slope would the graph of the model have?
Positive
Negative
There's no association

What kind of slope would the graph of the model have?
Positive
Negative
There's no association

What kind of slope would the graph of the model have?
Positive
Negative
There's no association

Which graph has no association?
A
B
C
D


F
G
H
J
What do you call when most of the data is located in a certain area on a graph?
Cluster
Gap
Peak
Data Party

Identify any outliers.
Outlier at x = 18
Outlier at x = 12
Outlier at x = 6
There aren't any outliers in this graph.

Identify any clusters.
Cluster at x = 14
Cluster at x = 18
Cluster at x = 24
There aren't any noteworthy clusters in this graph.

Is this line an accurate line estimate of best fit for the data?
Yes
No

Is this line an accurate line estimate of best fit for the data?
Yes
No

What are the coordinates of the outlier?
(1,9)
(9,1)
(2,2)
y=x

Which scatter plot shows a linear relationship between x and y?
Graph A
Graph B
Graph C
Graph D


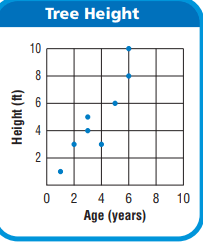
What is the age of the tree that is 8 feet tall?
6 Years
7 Years
8 Years
9 Years
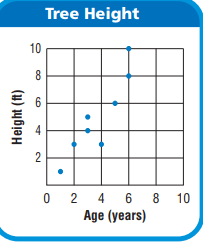
How many trees are 3 years old?
1
2
0
3

How many trees are more than 6 feet tall?
5
1
2
4

If a squirrel climbs to the top of each tree that is 6 years old, how far has the squirrel climbed?
2 ft
18 ft
10 ft
11 ft

Which height has the greatest frequency?
3 ft
10 ft
5 ft
6 ft
JoBeth draws a scatter plot that shows as the outside temperature increases, sales at her lemonade stand increase. Which best describes the scatter plot?
The points show that as x-values increase, y-values increase.
The points show that as x-values increase, y-values decrease.
The points show that as x-values decrease, y-values stay the same.
The points show that as x-values decrease, y-values increase.
Which of the following best describes a scatter plot that shows no relationship between the x-values and the y-values?
As x-values increase, the points are higher on the graph.
As x-values decrease, the points are higher on the graph.
The points are scattered around the graph.
The points form a horizontal line.

Which statement best describes the relationship between time shopping online and the number of stores visited?
As the number of hours increases, the number of stores decreases.
As the number of hours increases, the number of stores increases.
The number of hours and the number of stores are about the same.
As the number of hours decreases, the number of stores increases.

How much time did the person who visited 3 stores spend shopping online?
2 Hours
10 Hours
4 Hours
3 Hours

Mr. Reynosa plans to shop online for 4 hours for two days in a row. What is a reasonable prediction of how many stores he will visit?
10
8
12
22

Molly collected data about the number of hours students studied and their scores on a test. The results are shown in the scatter plot. Which statement about the data is true?
As study hours increase, test scores decrease.
As study hours increase, test scores increase.
As study hours increase, test scores stay the same.
As study hours decrease, test scores increase.

Which is a reasonable prediction of a test score for a student who studied for 1/2 hour?
80
100
50
5

Which relationship could be represented by this scatter plot?
As the number of muffins in a box increases, the price increases.
As the speed of a car increases, the distance the car travels increases.
As the population of a city increases, the number of schools in the
city increases.
As the number of daylight hours increases, the number of night hours decreases.

As the area of a garden increases, what happens to the number of plants in a garden?
The number of plants decreases.
The number of plants stays the same
The number of plants increases faster.
The number of plants increases.





Is this line an accurate line estimate of best fit for the data?
Yes
No
Is this line an accurate line estimate of best fit for the data?
Yes
No

What is the equation of the line of best fit
y= -2x + 10
y= 10x+ 2
y=2x+10
y= 10

Which sentence describes the relationship shown on this scatter plot?
As the temperature decreases, the visitors increase.
As the temperature increases, the number of visitors increases.
As the visitors increase, the temperature decreases.
No correlation
This measures how strong or weak the relationship between 2 quantitative variables are.
Scatter Plot
Causation
Correlation
Line of best fit

What is the y-intercept?
-2
3
2
-3


Is this line an accurate line estimate of best fit for the data?
Yes
No
Is this line an accurate line estimate of best fit for the data?
Yes
No

What is the equation of the line of best fit?
y= −21x + 6
y= 21x +6
y= 6x + 2
y = -2x +6
What is the equation of the line of best fit
y= -2x + 10
y= 10x+ 2
y=2x+10
y= 10

Which line is the best line of best fit?
a
b
c
i don't see any lines
What are the coordinates of the outlier?
(1,9)
(9,1)
(2,2)
y=x

What is the equation of the line of best fit?
y= 2x+3
y=3x+2
y= 21x +3
y= −21x +3



