
 Worksheets
Statistical Process Control (SPC) Quiz
Total questions: 82
Worksheet time: 41mins
What does SPC stand for in the context of quality management?
Statistical Process Control
Standardized Process Calculation
Systematic Process Coordination
Statistical Product Control
What is the primary goal of Statistical Process Control (SPC)?
Enhancing quality management through data-driven decisions
Standardizing production processes
Reducing production costs
Increasing product variety
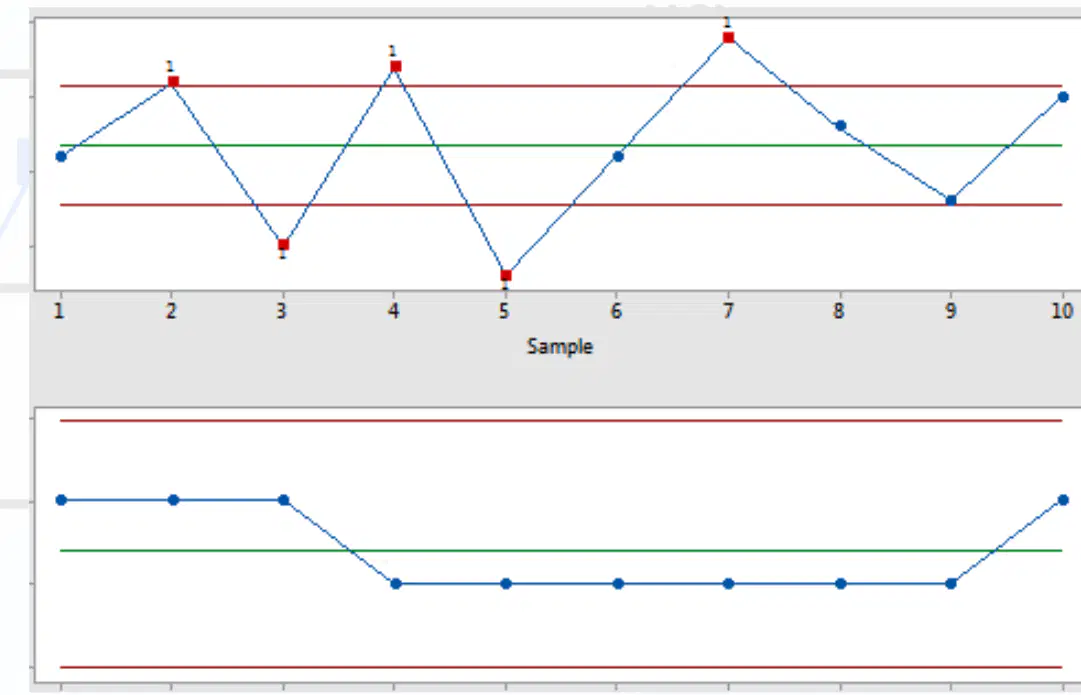
Which process looks more stable based on the given control charts?
The process with significant variation.
The process with consistent data points within control limits.
Both processes are equally stable.
Stability cannot be determined from the chart.
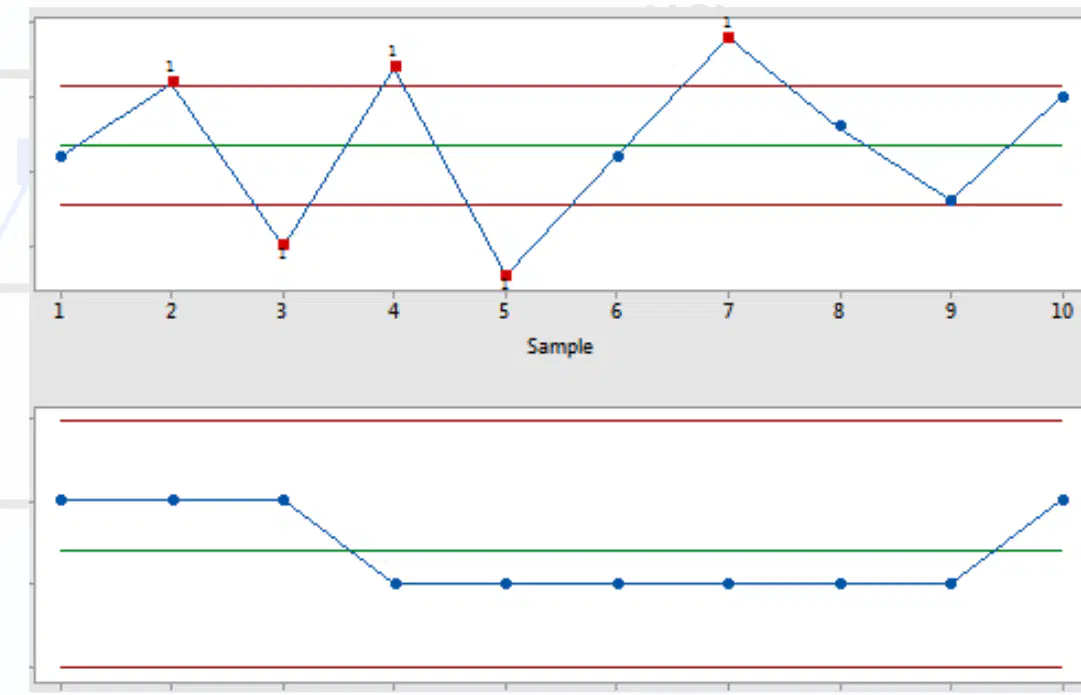
What could be a possible cause of variation in the unstable process shown in the control chart?
Random noise in the data.
External factors such as machine malfunction or human error.
Consistent and predictable performance.
Lack of data collection.
How would detecting variations in a process early benefit a company?
It allows the company to ignore minor issues.
It helps the company take corrective actions to improve quality and reduce costs.
It ensures that all processes remain unstable.
It has no impact on the company's performance.
What does SPC stand for in the context of quality management?
Statistical Process Control
Standard Process Calculation
Statistical Product Control
Systematic Process Coordination
Which of the following is NOT a common SPC tool?
Control charts
Histograms
Pareto analysis
Flowcharts
What are typical applications of SPC?
Manufacturing, healthcare, and service industries
Agriculture, education, and entertainment industries
Retail, tourism, and sports industries
Construction, fashion, and media industries
Which of the following is a disadvantage of using SPC in process control?
It requires significant training and expertise
It improves quality management
It helps detect variations in processes
It aids in making quality improvement decisions
What is the purpose of interpreting control charts in SPC?
To detect variations and make quality improvement decisions
To create new manufacturing processes
To eliminate all defects in production
To increase production speed
What does SPC stand for in the context of quality control?
Statistical Process Control
Standardized Product Control
Systematic Production Control
Statistical Product Certification
Who introduced Statistical Process Control (SPC) in the 1920s?
Walter A. Shewhart
W. Edwards Deming
Frederick Taylor
Joseph Juran
What is the main goal of SPC in quality control?
To detect defects after production
To ensure processes operate efficiently and produce products or services that meet specifications
To standardize production methods
To reduce production costs
How does SPC differ from traditional inspection-based methods?
SPC focuses on detecting defects after production
SPC is a proactive approach to quality control
SPC eliminates the need for statistical techniques
SPC focuses solely on product certification
Who further developed SPC after Walter A. Shewhart?
W. Edwards Deming
Joseph Juran
Frederick Taylor
Henry Ford
What does SPC help determine in a process?
Whether a process is efficient or inefficient
Whether variation is normal or abnormal
Whether a process is fast or slow
Whether a process is cost-effective or not
What is the term for variation that is inherent to the system and cannot be eliminated completely?
Special cause variation
Common cause variation
External cause variation
Systematic error variation
What is an example of a factor that can cause special cause variation?
Inherent system design
Machine malfunction
Consistent process flow
Stable environmental conditions
Which type of variation must be addressed to improve a process?
Common cause variation
Special cause variation
Normal variation
Systematic variation

What does SPC help organizations achieve in their processes?
Increase variation and inconsistency
Reduce variation and achieve consistency
Detect defects after they occur
Ignore process trends
How does SPC prevent defects in processes?
By detecting defects after they occur
By ignoring process trends
By preventing defects before they occur
By increasing variation in processes
Which methodologies does SPC align with to support continuous improvement?
Lean Manufacturing and Six Sigma
ISO 9001 and FDA regulations
Automotive industry requirements
Process variation and inconsistency
What does SPC identify to enhance efficiency in processes?
Process trends before they cause defects
Defects after they occur
Variations to increase inconsistency
Quality standards compliance
Which quality standards do industries use SPC to comply with?
ISO 9001, FDA regulations, and IATF 16949
Lean Manufacturing and Six Sigma
Process variation and inconsistency
Defect detection after occurrence
What is the first step in the Step-by-Step Approach of SPC?
Analysis
Corrective Actions
Data Collection
Control Charts
Which statistical technique is used in SPC to understand process performance?
Graphical tools
Statistical techniques
Corrective actions
Machine adjustments
What is the purpose of control charts in SPC?
To identify key parameters
To track process stability over time
To detect abnormal variations
To adjust machines
What action is taken in SPC when an abnormal variation is detected?
Data collection is repeated
Corrective actions are taken
Control charts are updated
Statistical analysis is performed
In the example provided, what does the operator do if the thickness of plastic bottles drifts outside control limits?
Stops production
Adjusts the machine
Replaces defective products
Collects more data
Which SPC tool is used to monitor process performance over time?
Histograms
Control Charts (Shewhart Charts)
Pareto Analysis
Scatter Diagrams
What is the purpose of histograms in SPC?
To identify root causes of defects
To show relationships between two variables
To show the distribution of data
To monitor process performance over time
Which SPC tool helps identify the most significant defects or causes of variation?
Pareto Analysis
Scatter Diagrams
Control Charts
Histograms
What is another name for the Cause-and-Effect Diagram?
Ishikawa/Fishbone Diagram
Pareto Chart
Scatter Diagram
Histogram
Which SPC tool shows relationships between two variables, such as temperature vs. defect rate?
Histograms
Scatter Diagrams
Pareto Analysis
Control Charts
How is SPC used in the manufacturing industry?
To ensure product consistency and reduce waste
To monitor patient health trends and reduce medical errors
To improve efficiency and customer satisfaction
To enhance supplier quality and reduce defects
What is the primary purpose of SPC in healthcare?
To monitor patient health trends and reduce medical errors
To improve efficiency and customer satisfaction
To enhance supplier quality and reduce defects
To ensure product consistency and reduce waste
Which industry uses SPC to improve efficiency and customer satisfaction?
Service Industries
Manufacturing
Healthcare
Supply Chain Management
What is the role of SPC in supply chain management?
To enhance supplier quality and reduce defects
To monitor patient health trends and reduce medical errors
To improve efficiency and customer satisfaction
To ensure product consistency and reduce waste
What does SPC help detect in manufacturing to prevent defective products?
Machine wear and tear
Employee productivity
Customer satisfaction
Marketing strategies
How does SPC ensure consistency in manufacturing?
By monitoring assembly line operations
By increasing production speed
By reducing employee workload
By focusing on product design
What is one of the benefits of using SPC in manufacturing?
Reducing scrap and rework costs
Increasing advertising budget
Enhancing customer service
Improving packaging design
In the example provided, what does the automotive company monitor using SPC?
The diameter of piston rings
The color of the product
The weight of the vehicle
The speed of production
What action does the automotive company take if measurements deviate from the set tolerance?
Adjust the machine before producing defective rings
Increase production speed
Change the product design
Hire more employees
What does SPC help track in healthcare to prevent outbreaks?
Infection rates
Medication costs
Patient satisfaction
Hospital cleanliness
Which of the following is an example of monitoring patient vital signs using SPC in healthcare?
Blood pressure and heart rate
Patient age and weight
Medication costs and availability
Hospital cleanliness and hygiene
How does SPC help reduce medication errors in healthcare?
By analyzing prescription patterns
By tracking patient satisfaction
By monitoring hospital cleanliness
By reducing staffing levels
What action is taken if delays in emergency care exceed control limits, according to SPC principles?
Staffing adjustments are made
Medication costs are reduced
Patient satisfaction surveys are conducted
Hospital cleanliness is improved
How do call centres use SPC to improve customer service?
By monitoring response times
By tracking customer complaints
By detecting fraudulent transactions
By analyzing staffing levels
What is one way financial institutions use SPC?
To monitor response times
To detect fraudulent transactions
To track customer complaints
To improve staffing levels
How do retail businesses use SPC to improve service quality?
By monitoring response times
By tracking customer complaints
By detecting fraudulent transactions
By analyzing waiting times
What action does a bank take when SPC shows increased customer waiting times?
They reduce the number of staff
They adjust staffing levels
They increase customer complaints tracking
They monitor fraudulent transactions
What does SPC help track in supply chain management to ensure quality materials?
Supplier defect rates
Delivery schedules
Customer satisfaction rates
Employee performance metrics
How does SPC contribute to reducing variability in supply chain management?
By identifying demand patterns
By ensuring consistent delivery times
By tracking customer feedback
By monitoring employee productivity
What is one way SPC helps optimize inventory management?
By identifying demand patterns
By reducing supplier costs
By increasing production speed
By improving employee training
In the example provided, what action does the electronics company take when defect rates increase?
They work with the supplier to resolve quality issues
They increase production to meet demand
They change their delivery schedules
They hire more employees to inspect shipments
What is one of the advantages of Statistical Process Control (SPC)?
It increases defects in production.
It reduces waste and rework, saving costs.
It decreases customer satisfaction.
It eliminates the need for data-driven decision-making.
How does SPC enhance customer satisfaction?
By increasing defects in production.
By stabilizing operations.
Through consistent product quality.
By eliminating quality control processes.
Which of the following is a benefit of data-driven decision-making in SPC?
It improves quality control.
It increases waste and rework.
It reduces process efficiency.
It decreases customer satisfaction.
What does SPC aim to prevent before they occur?
Customer satisfaction.
Defects.
Process efficiency.
Waste and rework.
How does SPC increase process efficiency?
By stabilizing operations.
By reducing customer satisfaction.
By increasing waste and rework.
By eliminating quality control processes.
What is one of the disadvantages of SPC related to personnel?
Requires trained personnel to interpret data correctly
SPC is suitable for all processes
SPC eliminates the need for data collection
SPC reduces initial costs for software and training
Which of the following is a financial disadvantage of implementing SPC?
Complexity in data collection
Initial costs for SPC software, training, and process adjustments
Resistance to change from employees
SPC is suitable for highly unpredictable processes
Why are not all processes suitable for SPC?
SPC requires trained personnel
Some processes are highly unpredictable
SPC eliminates the need for monitoring variables
SPC reduces resistance to change
What makes data collection complex in SPC?
Monitoring many variables
Resistance to change from employees
Lack of trained personnel
High initial costs
What is a common challenge faced by employees when implementing SPC?
Complexity in data collection
Resistance to change
High initial costs
SPC is suitable for all processes
What is one way to overcome SPC challenges in an organization?
Avoid SPC training for employees
Automate data collection using SPC software
Ignore leadership support
Discourage continuous improvement
Why is it recommended to start small with a pilot program before full SPC implementation?
To avoid leadership involvement
To test and refine the process before scaling
To discourage teamwork
To eliminate SPC software usage
How can leadership support help in overcoming SPC challenges?
By driving SPC culture
By avoiding SPC training
By discouraging teamwork
By eliminating continuous improvement
What is the role of continuous improvement in overcoming SPC challenges?
It encourages teamwork and better results
It eliminates the need for SPC software
It discourages leadership involvement
It avoids pilot programs
Which type of SPC control chart is used for variable data, such as product dimensions?
P Charts
C Charts
X̄ and R Charts
U Charts
What type of SPC control chart is used for attribute data, such as pass/fail rates?
X̄ and R Charts
P Charts
U Charts
C Charts
Which SPC control chart is specifically used to count defects per unit?
U Charts
P Charts
C Charts
X̄ and R Charts
When sample sizes vary, which SPC control chart is most appropriate to use?
X̄ and R Charts
P Charts
C Charts
U Charts
What is the average X bar value for the given data in the X and R chart?
29.9
32.5
28.75
34.5
What is the R bar value for the given data in the X and R chart?
11.85
10.75
12.5
9.85
Which sample has the highest range (R) value in the X and R chart?
Sample 9
Sample 11
Sample 6
Sample 16
What is the measured value for Sample 4 in column 3 of the X and R chart?
56
26
21
44
What is the sample average (X bar) for Sample 16 in the X and R chart?
53.5
51.75
51.5
50
What does a stable process indicate in control charts?
Data points are within control limits.
Data points fall outside control limits.
Trends or outliers appear.
Data points are randomly distributed.
What action is required when trends or outliers appear in control charts?
Investigate the cause.
Ignore the data points.
Assume the process is stable.
Adjust the control limits.
What does an unstable process indicate in control charts?
Data points fall outside control limits or show trends.
Data points are within control limits.
No action is required.
The process is functioning optimally.
How does a food manufacturer use an X̄-R chart in monitoring packaging weights?
To adjust filling machines if variation increases.
To ignore variations in packaging weights.
To ensure data points fall outside control limits.
To stop production when weights are consistent.

