
Font size
 Worksheets
Geography Class Test Worksheet (Std. 9) – Extracted Questions
Total questions: 29
Worksheet time: 15mins
Choose the correct alternative and rewrite the sentence: Which among the following rights are not included in human rights?
Right to work
Right to information
Children's rights
Equal pay for equal work
Choose the correct alternative and rewrite the sentence: Which among the following days is observed on an international level?
Teachers' Day
Children's Day
Earth Day
Flag Day
Choose the correct alternative and rewrite the sentence: Which among the following is an international problem?
Border dispute between Maharashtra and Karnataka
Kaveri water sharing question
Problems of refugees
Naxalism in Andhra Pradesh
Choose the correct alternative and rewrite the sentence: Which of these is a fold mountain?
The Satpudas
The Himalayas
The western Ghats
State whether the given statement is right or wrong and correct the wrong one: Choose the correct statement.
The temperature range helps the wind in its work.
The temperature range helps mechanical weathering in its work.
State whether the given statement is right or wrong and correct the wrong one: Choose the correct statement.
Mechanical weathering is less effective in humid climate.
Mechanical weathering is more effective in humid climate.
State whether the given statement is right or wrong and correct the wrong one: Choose the correct statement.
The river flows at a faster speed than the glacier.
The glacier flows at a faster speed than the river.
State whether the given statement is right or wrong and correct the wrong one: Choose the correct statement.
The main aim of distributional maps is to show location.
The main aim of distributional maps is to show the distribution of phenomena.
State whether the given statement is right or wrong and correct the wrong one: Choose the correct statement.
The speed of the glacier is more on both the banks than in the middle.
The speed of the glacier is more in the middle than on both the banks.

Question related to graph/diagram: Answer the following based on the Kolhapur District Average Annual Rainfall map showing isohyets labeled 2400, 1800, 1200, and 600 mm with a north arrow and scale. In which direction is the rainfall more in the district?
North
South
East
West

Question related to graph/diagram: Answer the following based on the Kolhapur District Average Annual Rainfall map showing isohyets labeled 2400, 1800, 1200, and 600 mm with a north arrow and scale. In which direction is the rainfall decreasing in the district?
From west to east
From east to west
From north to south
From south to north
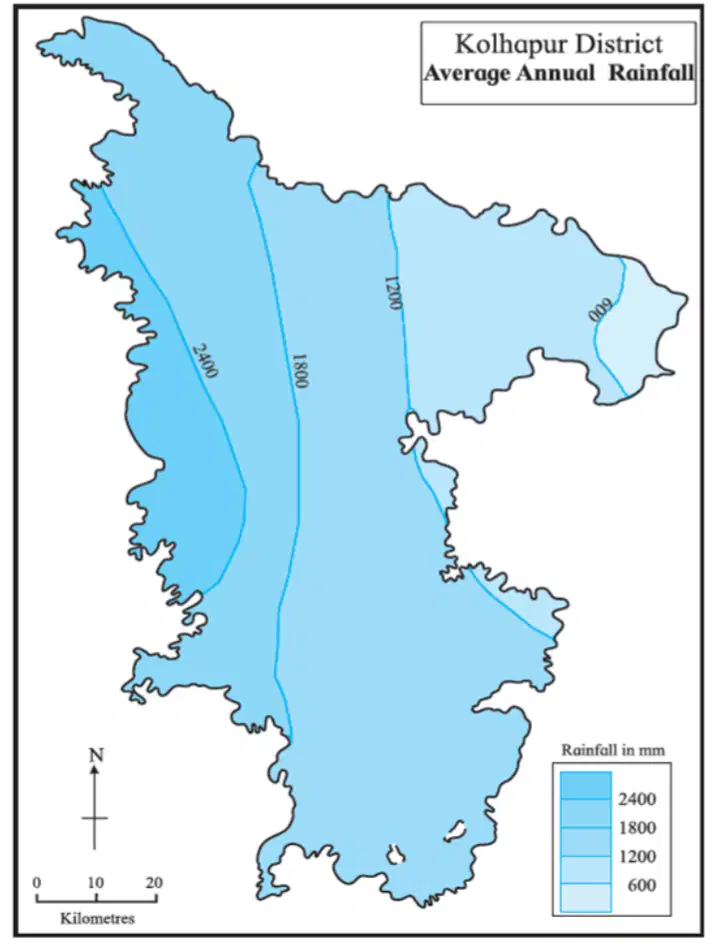
Question related to graph/diagram: Answer the following based on the Kolhapur District Average Annual Rainfall map showing isohyets labeled 2400, 1800, 1200, and 600 mm with a north arrow and scale. Which class shows low rainfall category in the district?
2400 mm
1800 mm
1200 mm
600 mm
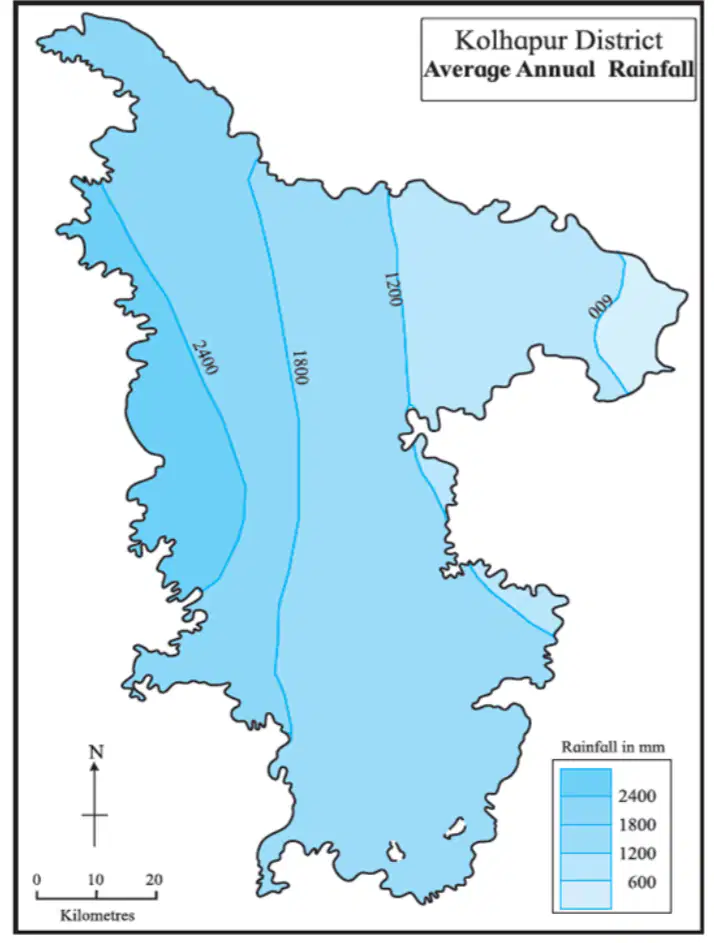
Question related to graph/diagram: Answer the following based on the Kolhapur District Average Annual Rainfall map showing isohyets labeled 2400, 1800, 1200, and 600 mm with a north arrow and scale. Which class shows high rainfall category in the district?
2400 mm
1800 mm
1200 mm
600 mm

Question related to graph/diagram: Answer the following based on the Kolhapur District Average Annual Rainfall map showing isohyets labeled 2400, 1800, 1200, and 600 mm with a north arrow and scale. Which method has been used in preparing this map?
Choropleth method
Dot distribution method
Isopleth (isohyet) method
Pictorial symbol method
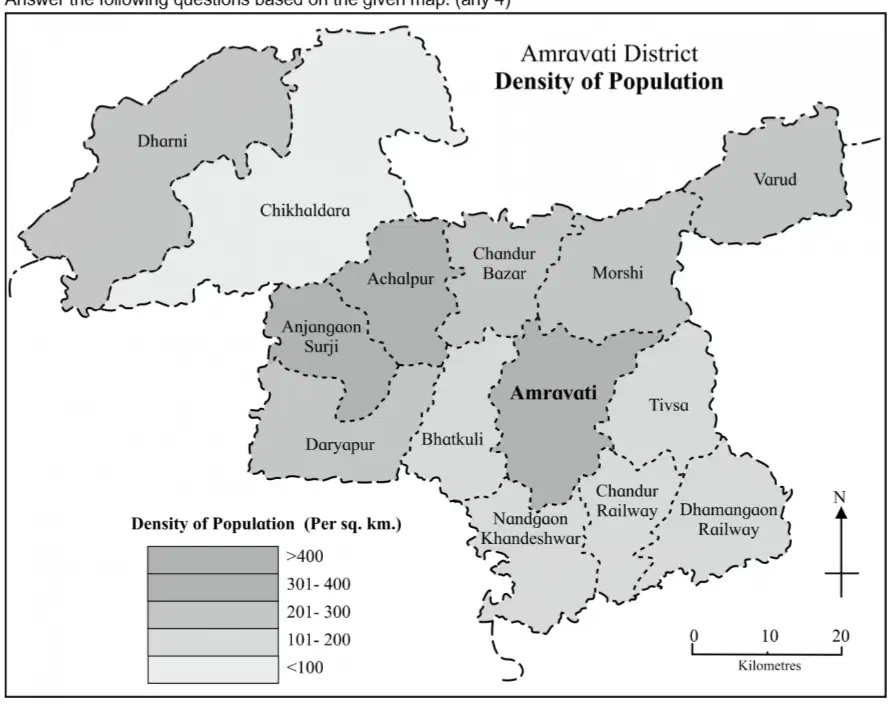
Answer the following based on the Amravati District Density of Population map: Name the taluka having population density between 301 and 400 persons per sq. km. (any 4)
Chandur Railway
Morshi
Daryapur
Varud
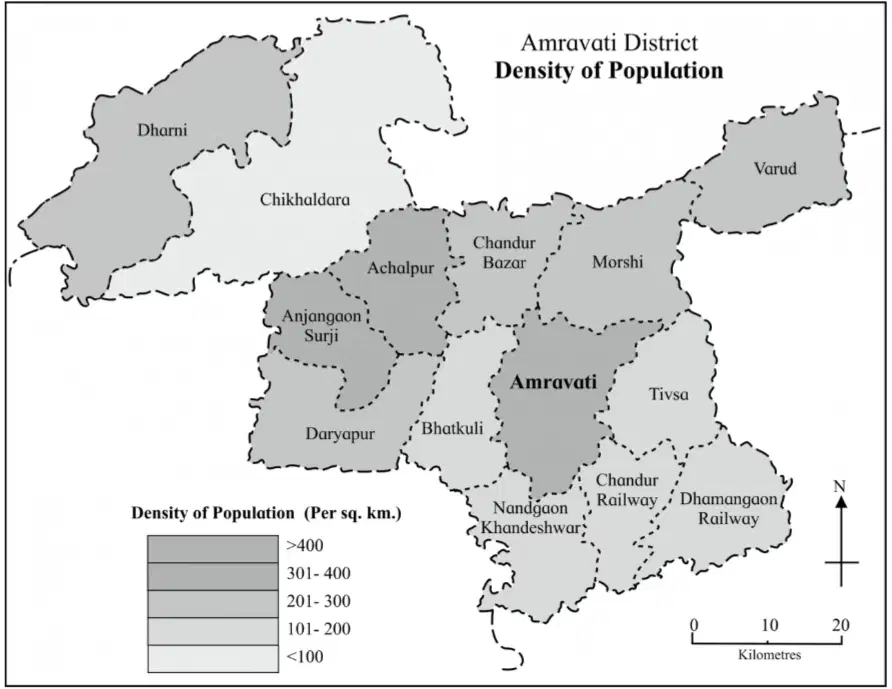
Answer the following based on the Amravati District Density of Population map: What is the population density category of Amravati taluka? (any 4)
>400
301–400
201–300
101–200
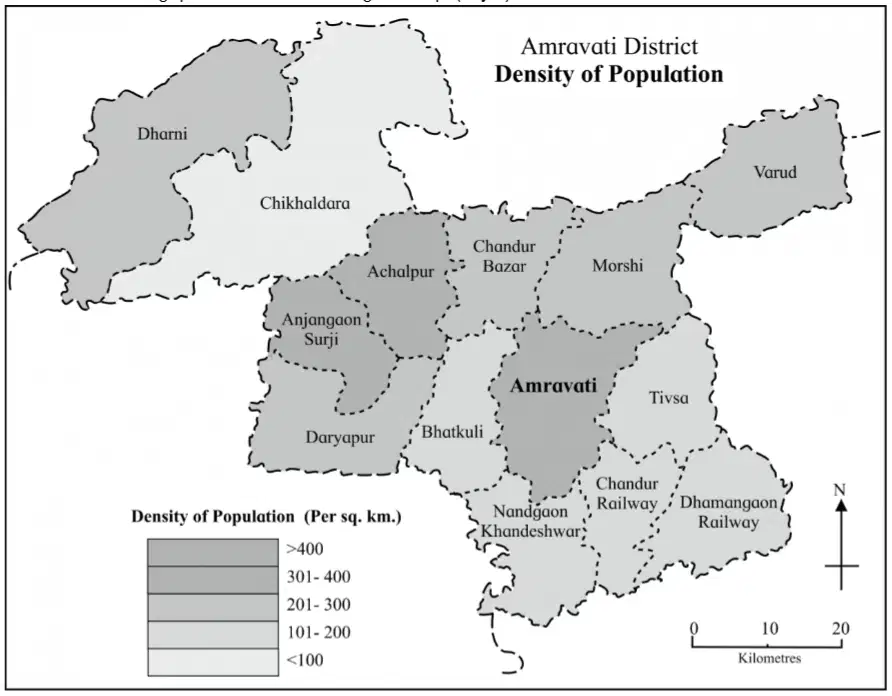
Answer the following based on the Amravati District Density of Population map: Name the taluka having population density around 300 persons per sq. km. (any 4)
Morshi
Tivsa
Achalpur
Bhatkuli
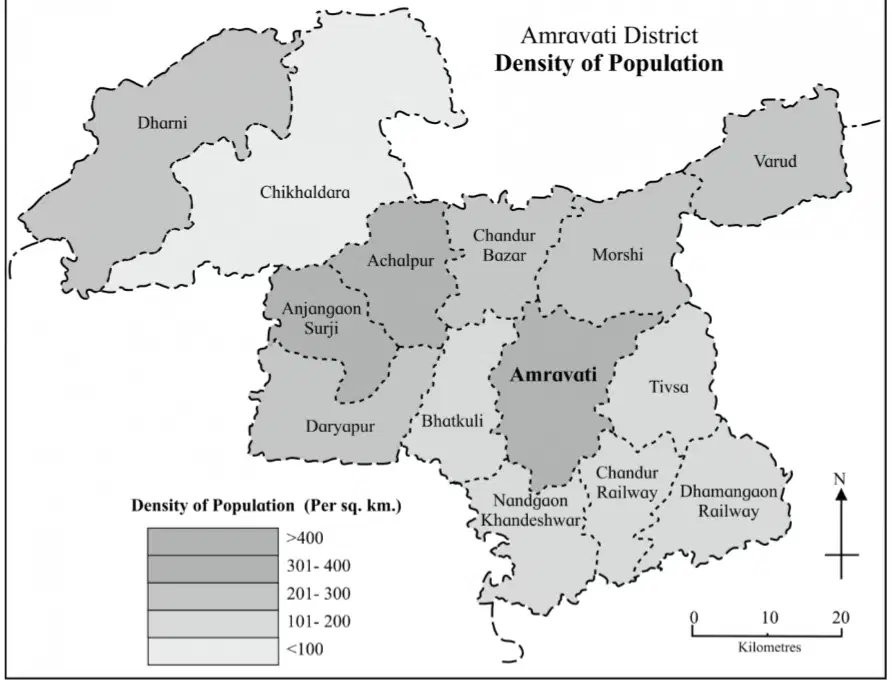
Answer the following based on the Amravati District Density of Population map: Which taluka has a population density of less than 100 persons per sq. km? (any 4)
Chikhaldara
Varud
Nandgaon Khandeshwar
Chandur Bazar
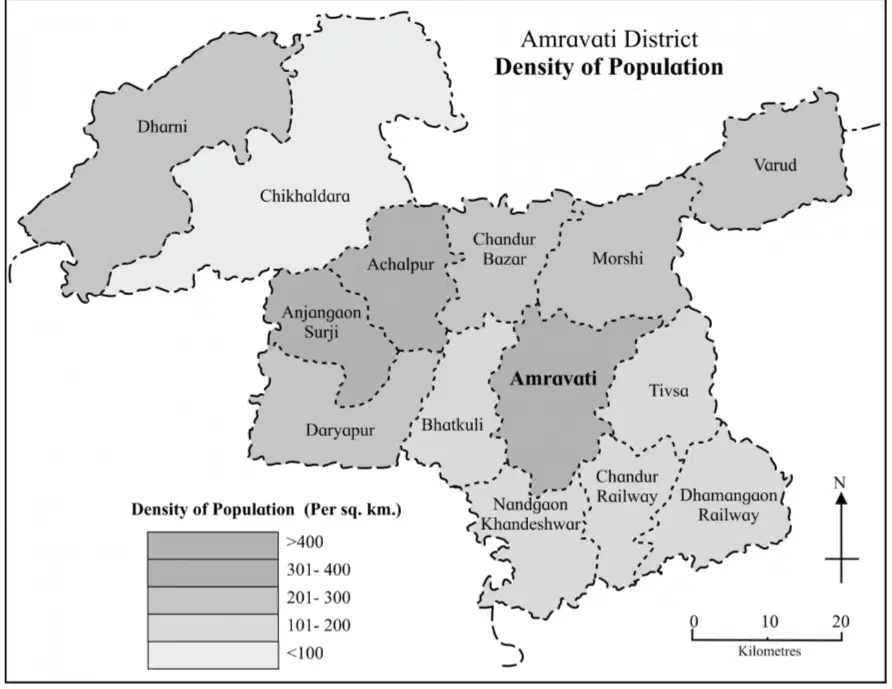
Answer the following based on the Amravati District Density of Population map: Which taluka has a population density of more than 400 persons per sq. km? (any 4)
Amravati
Dhamangaon Railway
Anjangaon Surji
Daryapur
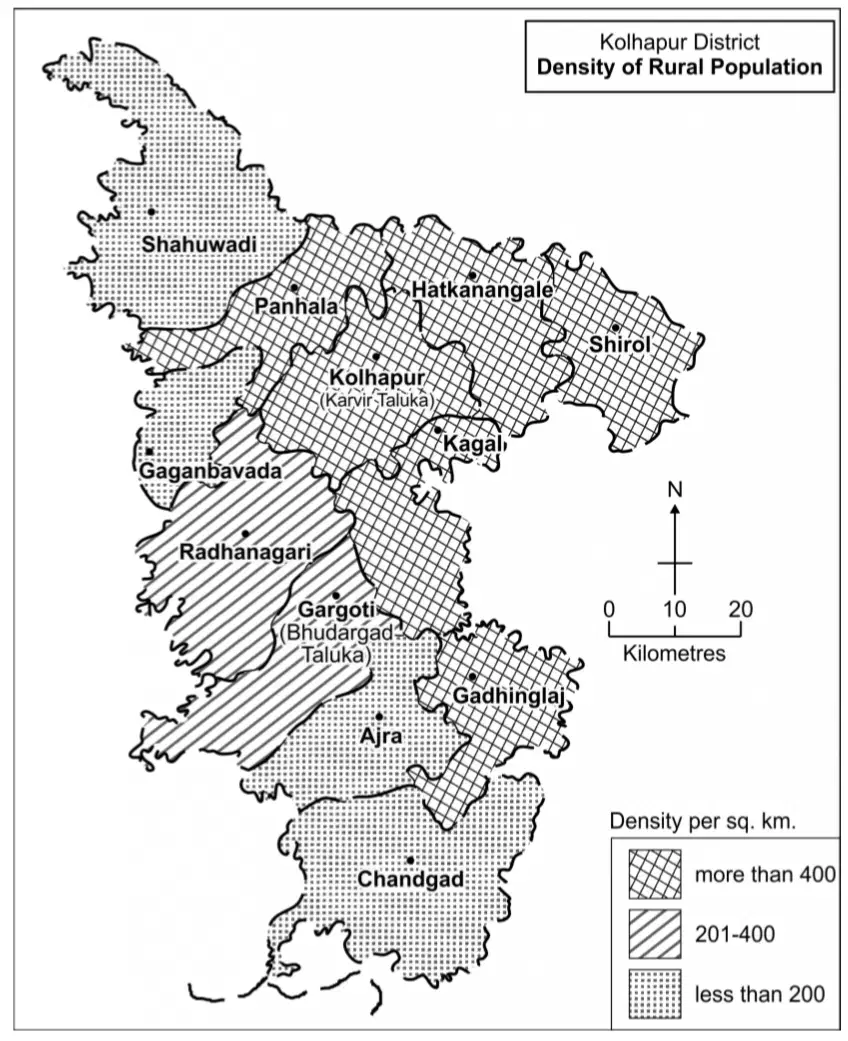
Answer the following based on the Kolhapur District Density of Rural Population map: In which direction is the density of population decreasing? (any 4)
Towards the south and west
Towards the north-east
From south to north
Uniform in all directions
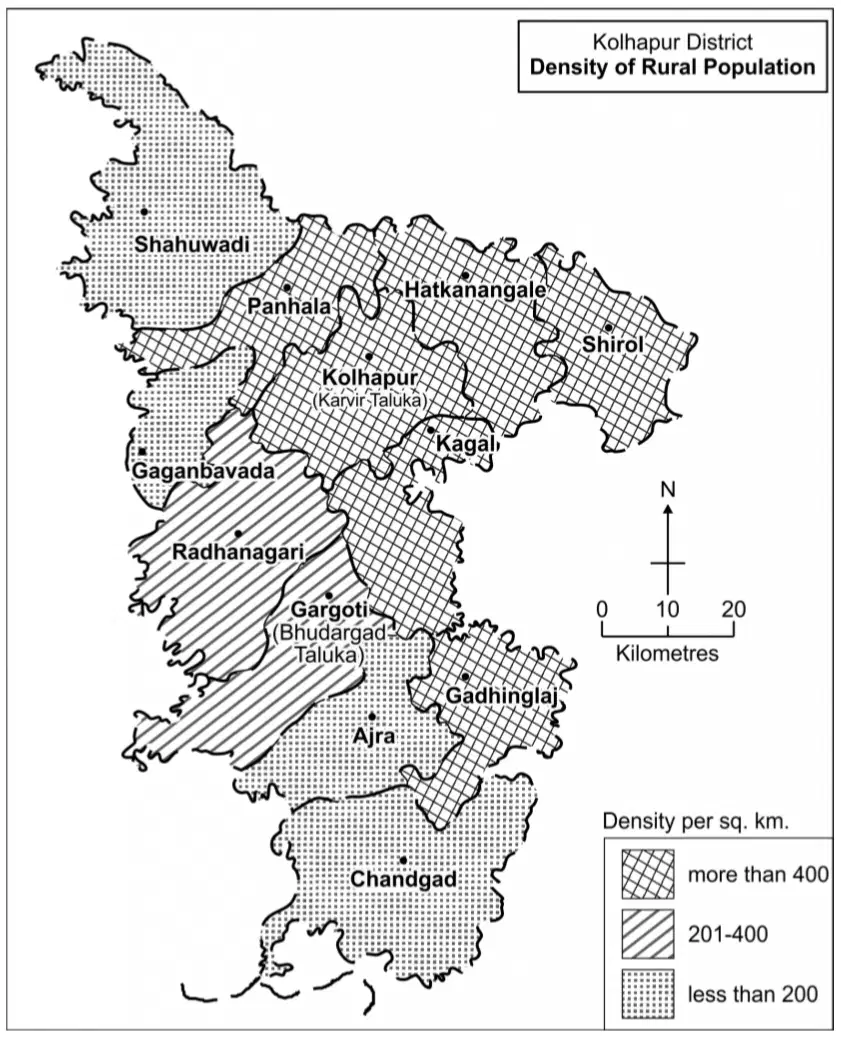
Answer the following based on the Kolhapur District Density of Rural Population map: Select the talukas with population density less than 200 persons per sq. km. (any 4)
Chandgad
Ajra
Shahuwadi
Gaganbavada

Answer the following based on the Kolhapur District Density of Rural Population map: Select the talukas having population density between 200 and 400 persons per sq. km. (any 4)
Radhanagari
Gargoti (Bhudargad Taluka)
Hatkanangale
Kagal
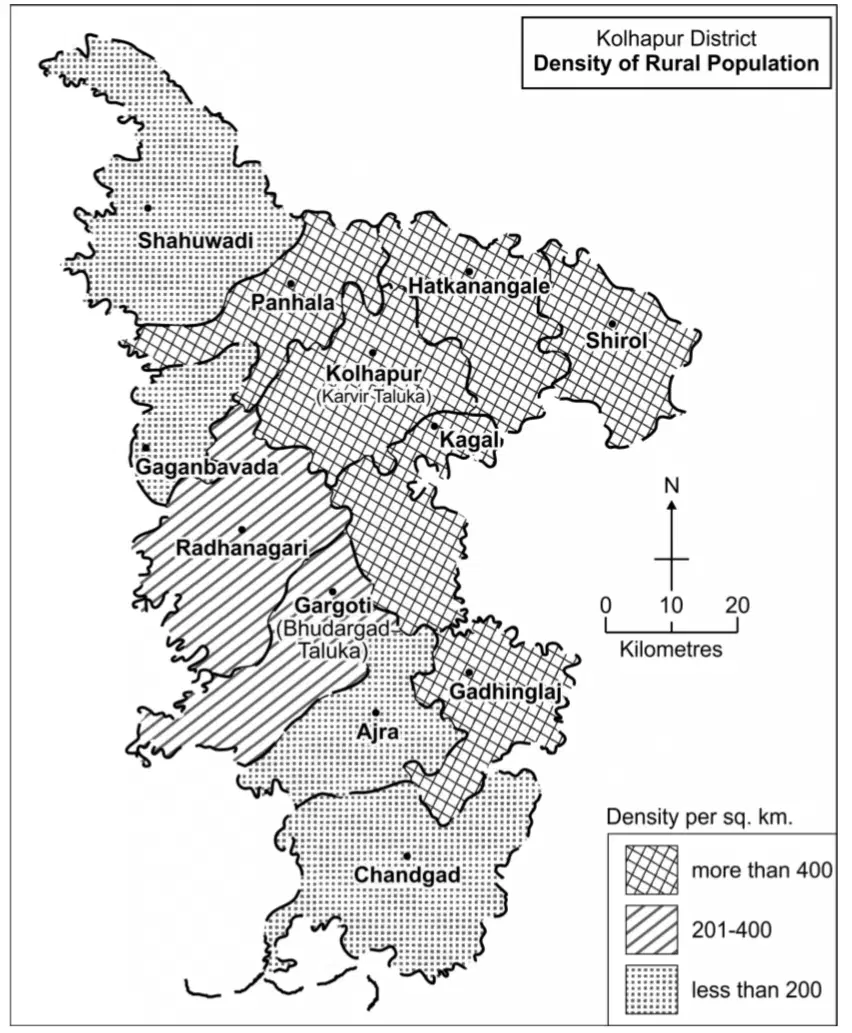
Answer the following based on the Kolhapur District Density of Rural Population map: Name the taluka with population density more than 400 persons per sq. km. (any 4)
Kolhapur (Karvir Taluka)
Hatkanangale
Kagal
Shirol
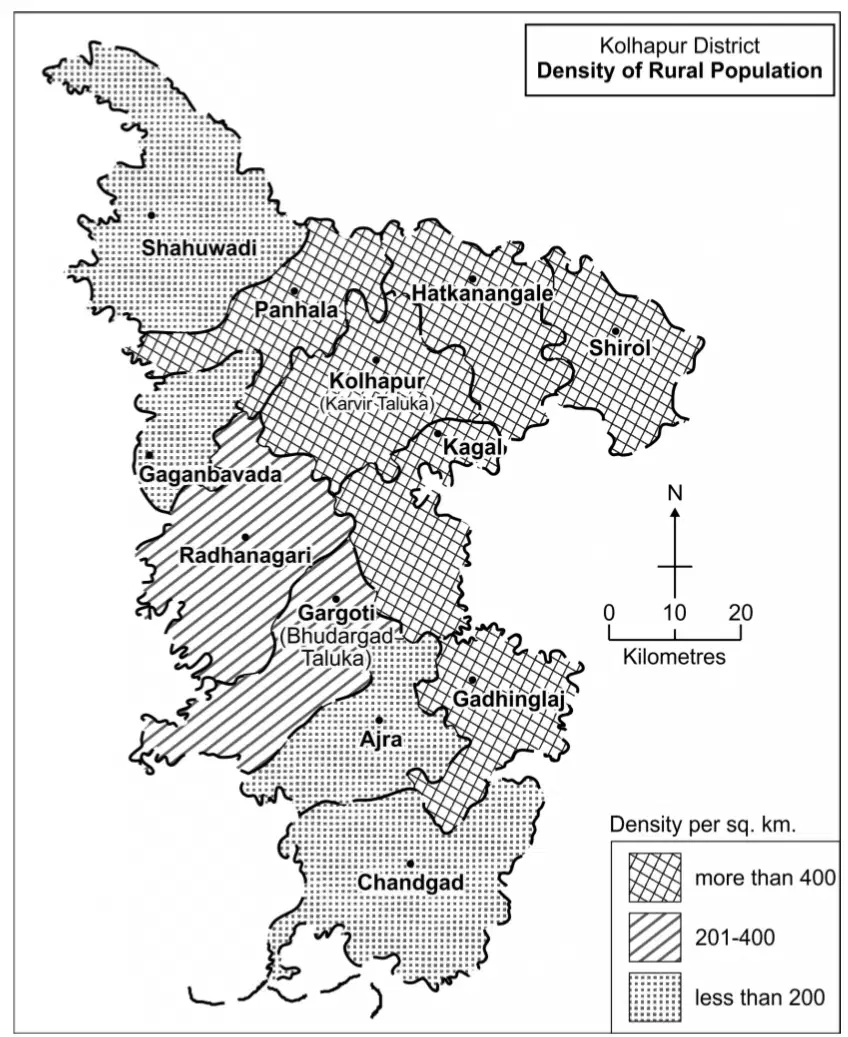
Answer the following based on the Kolhapur District Density of Rural Population map: In which part of the district are the talukas with higher density of population located? (any 4)
Central part
Western coastal belt
Northern fringe
Southern border
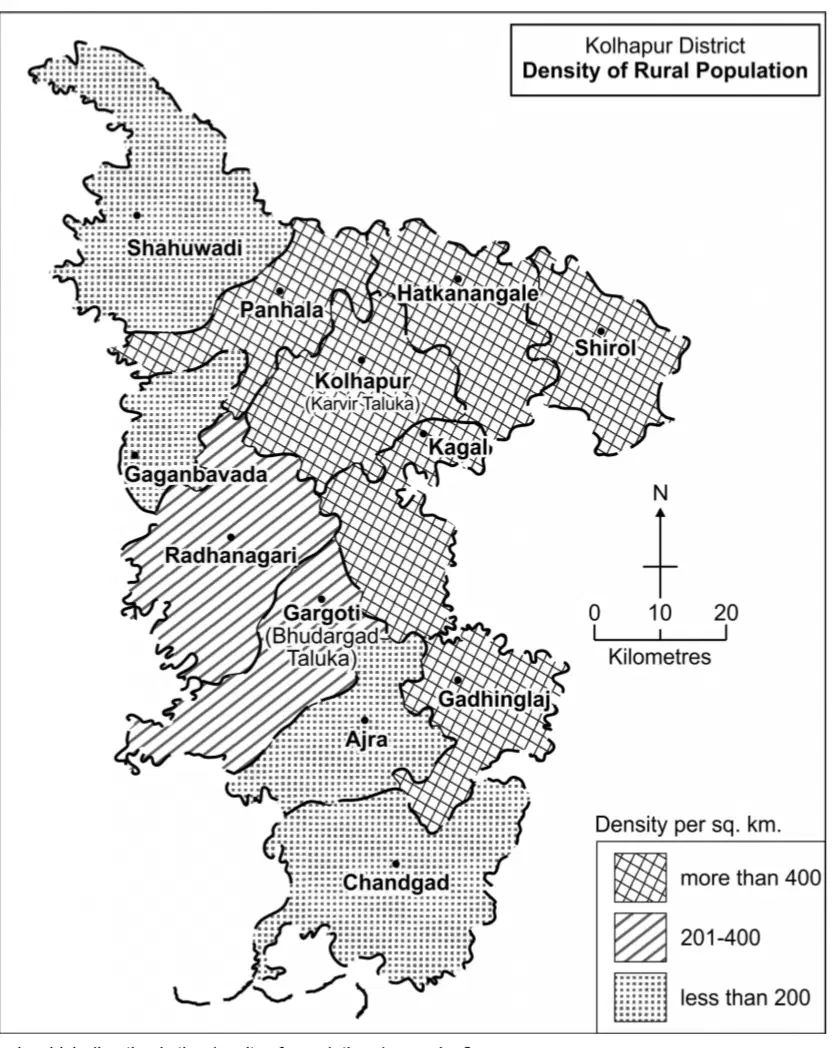
Answer the following based on the Kolhapur District Density of Rural Population map: Which method has been used in preparing this map? (any 4)
Choropleth method
Isopleth method
Dot density map
Flow map

Answer based on the Kolhapur district population map. The legend shows rural population with a dot method where each dot represents 5000 people, and major cities are shown with graduated pink circles. Which method is used to show the rural distribution of population in the district?
Dot method
Choropleth shading
Isopleth lines
Flow map arrows
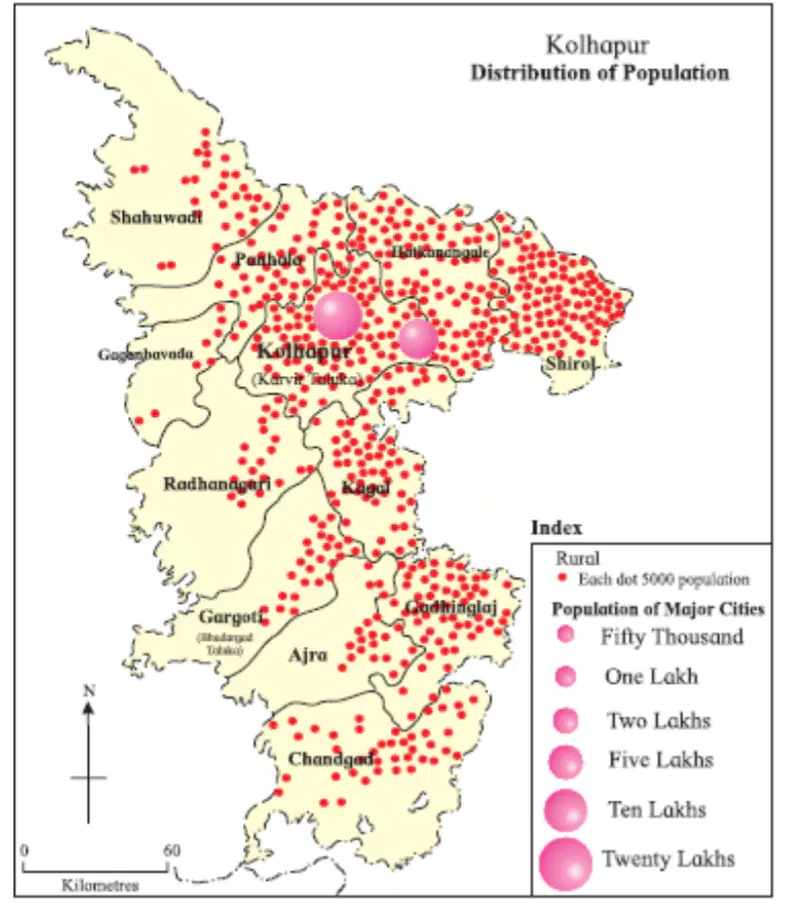
Using the Kolhapur district population map (red dots equal 5000 people; larger pink circles indicate city population), which statement best describes the directionwise change in population density across the district?
Density is highest in the north and central parts and becomes sparse toward the southern talukas
Density increases steadily from west to east with the south remaining uniformly dense
Density is highest along the southern border and decreases toward the center
Density is uniformly distributed in all directions with no clear variation
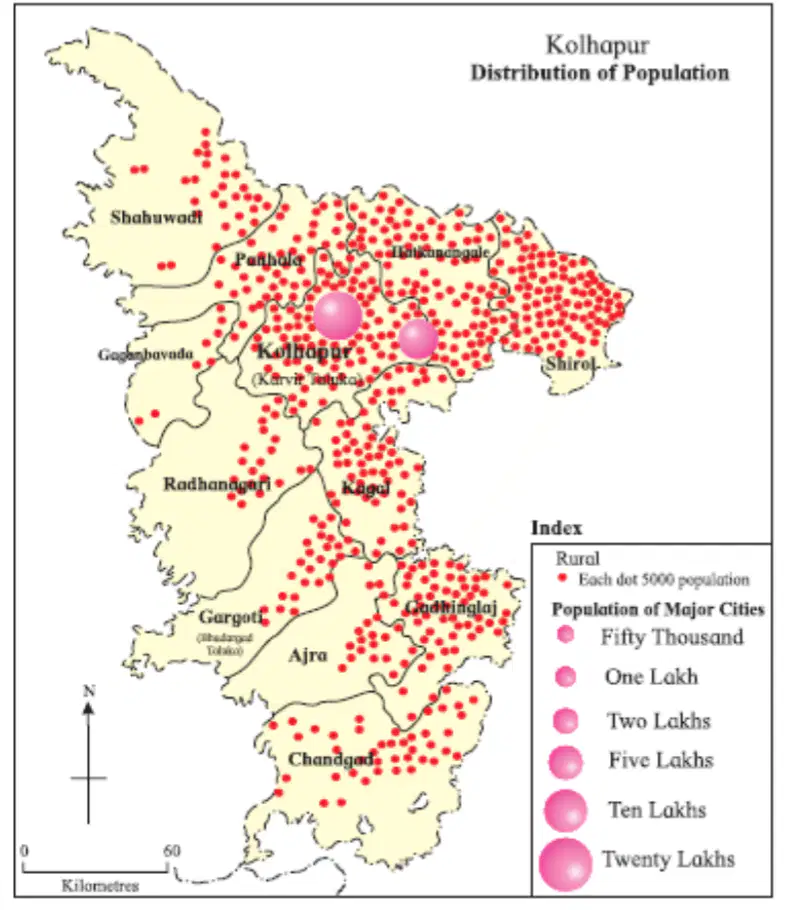
Refer to the Kolhapur district population map. The largest pink circle marks the most populous city shown. What population does this largest circle represent, and which place is it?
Ten Lakhs, Kolhapur
Twenty Lakhs, Kolhapur
Five Lakhs, Shirol
Two Lakhs, Ajra
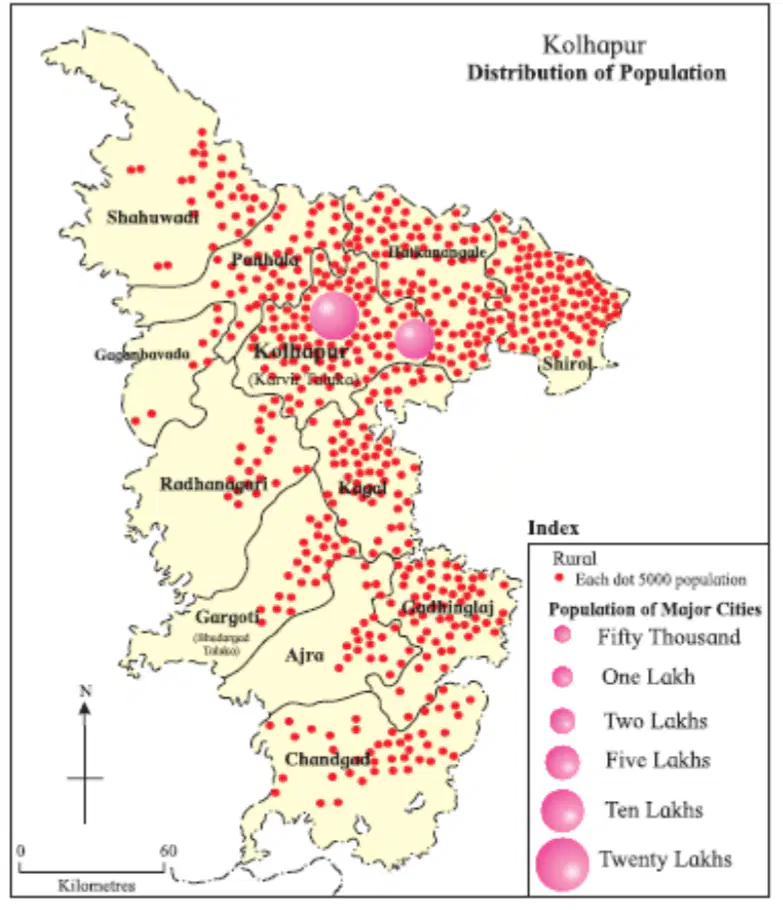
From the Kolhapur district population map where each red dot equals 5000 people, which taluka shows the least population?
Chandgad
Kolhapur
Shirol
Ajra

