
 Worksheets
PETE 3050 Final Exam
Total questions: 31
Worksheet time: 17mins
For a given time, the radius of investigation is the distance from the well where the pressure change has been felt.
True
False
Radius of investigation does not change with changing the production rate.
True
False
The pressure change beyond the radius of investigation is independent of rate.
True
False
After the pressure effect is felt at the boundary, the flow regime switches from transient to PSS
True
False
After the pressure effect is felt at the boundary, the flow regime switches from transient to PSS only if there is no external support.
True
False
After the pressure effect is felt at the boundary, the flow regime switches from transient to PSS only if there is no external support. In addition, production rate at standard conditions must be constant.
True
False
PSS/SS flow regimes are always preceded by transient flow.
True
False
Pressure derivative with respect to time (𝜕𝑝/𝜕𝑡) is negative during production.
True
False
Pressure derivative with respect to time (𝜕𝑝/𝜕𝑡) is independent of radius and time during PSS flow.
True
False
For a constant rate, 𝜕𝑝/𝜕𝑟 is constant at the wellbore regardless of flow regime.
True
False
At any given location in the reservoir, 𝜕𝑝/𝜕𝑟 does not vary with time over the PSS flow period.
True
False
For PSS flow, 𝜕𝑝/𝜕𝑟 is zero at the reservoir external boundary.
True
False
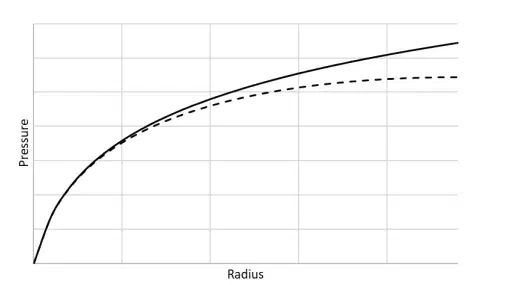
The Cartesian graph shows the pressure versus radius. The solid curve shows _______and the dashed curve shows________.
Steady State; Pseudo Steady State
Pseudo Steady State; Steady State
Steady State; Transient State
Pseudo Steady State; Transient State
Transient State; Pseudo Steady State
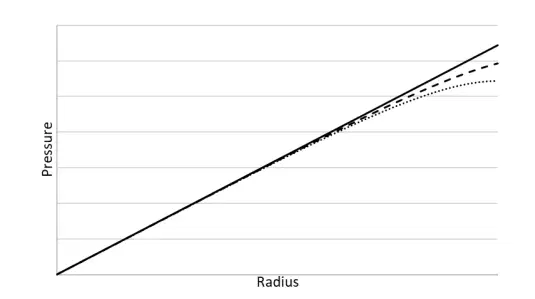
The semilogx graph below shows the pressure versus radius. SS is shown by_____curve and the PSS is shown by_____curve.
solid; dotted
dotted; solid
dotted; dashed
dashed; solid
solid; dashed
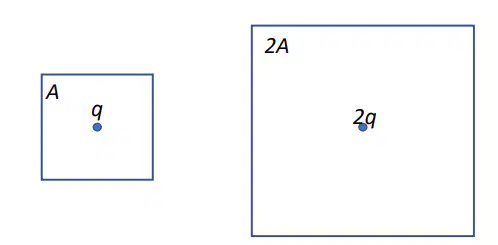
The wells in Figure 7-9 below experience identical decrease in the average pressure under PSS flow.
True
False
The wells in Figure 7-9 below experience identical decrease in the flowing pressure under PSS flow.
True
False
Exponential integral of a negative number is positive.
True
False
The exponential integral can be approximated by logarithmic function after sufficiently long time.
True
False
The exponential integral can be approximated by logarithmic function after sufficiently long time.
True
False
The well production at the surface comes purely from expansion of the wellbore fluids at the beginning of a well test.
True
False
Constant production rate at the surface implies constant rate at the sandface.
True
False
Constant production rate at the surface implies constant rate at the sandface after sufficiently long time.
True
False
In the context of well pressure testing, p is
Pi - Pwf
Pi - P
P - Pwf
dΔp/dlnt = t dΔp/dt.
True
False
The slope of logarithmic pressure derivative on the log-log diagnostic plot is zero during the transient radial flow.
True
False
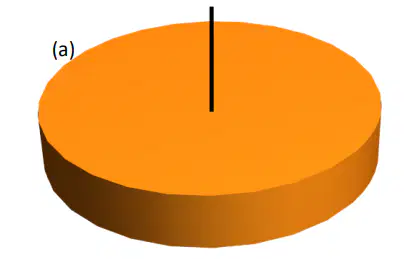
a homogeneous and isotropic reservoir with a vertical well
a cylindrical volume element
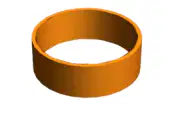
a homogeneous and isotropic reservoir with a vertical well
a cylindrical volume element
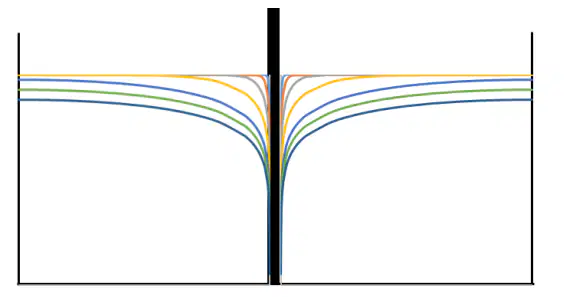
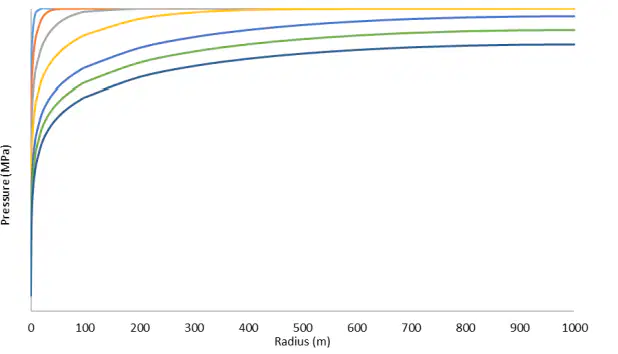
flow before the effect of pressure drop is felt at the boundary of the reservoir
(a)
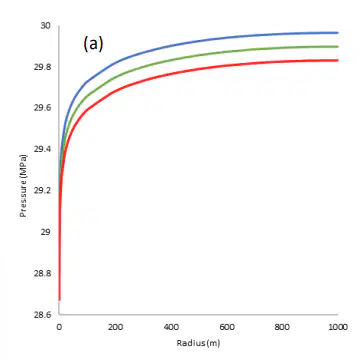
After the pressure drop is felt at all reservoir boundaries, the flow regime is called (a) considering constant production rate from the reservoir and no fluid support beyond the boundaries.
Cartesian graph
semi log graph
log graph

Cartesian graph
semi log graph
log graph

