
 Worksheets
Midterm Study Guide - ES
Total questions: 46
Worksheet time: 23mins

What is natural selection and how does it affect populations?
A nonrandom process where heritable traits that increase fitness become more common over generations
A random change in allele frequencies with no relation to fitness
A process in which individuals change traits by use and disuse during their lifetimes
Migration that equalizes traits across all populations

Which survivorship curve represents species that produce many offspring with low survival?
Type I
Type II
Type III
Type IV
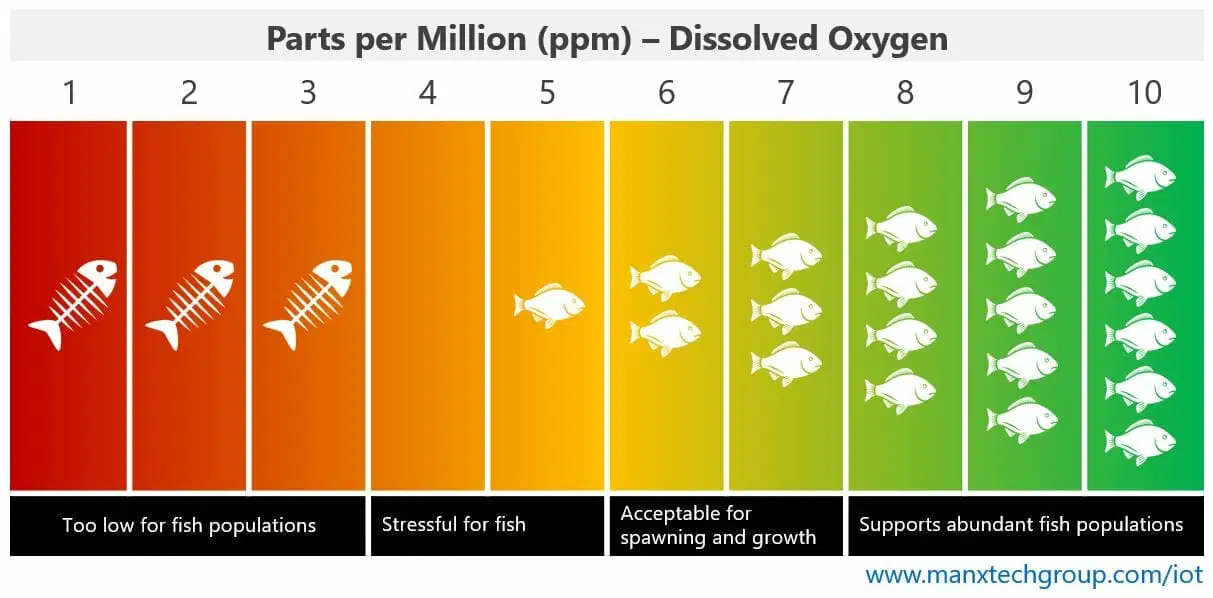
How does dissolved oxygen in water change with temperature?
It decreases as temperature increases because gases are less soluble in warm water
It increases as temperature increases because gas solubility rises in warm water
It is independent of temperature under natural conditions
It oscillates unpredictably with seasonal changes and shows no overall trend

What causes the rainshadow effect?
Moist air rises over mountains, cools and loses moisture on the windward side; dry air descends on the leeward side
Warm ocean currents add moisture to leeward slopes, causing deserts on windward slopes
High latitude reduces solar heating, creating deserts behind mountains
Urban heat islands block rainfall downwind of cities, creating deserts

Why does anchovy biomass collapse during El Niño events?
Coastal upwelling weakens, reducing nutrient supply and primary productivity that support anchovies
Stronger trade winds increase upwelling, causing anchovies to disperse harmlessly offshore
Colder surface waters increase oxygen, leading to overpopulation crashes
Predator numbers decline, causing anchovies to starve from lack of prey
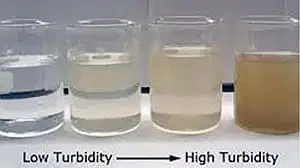
How does turbidity affect photosynthesis in aquatic systems?
Higher turbidity reduces light penetration and lowers photosynthetic rates
Higher turbidity increases light scattering and enhances photosynthesis at depth
Turbidity only affects temperature, not light, so photosynthesis is unchanged
Turbidity raises dissolved oxygen directly, increasing photosynthesis

Define carrying capacity in population ecology.
The maximum population size an environment can sustain over time given available resources
The total number of offspring an individual can produce in one season
The average population size during exponential growth
The minimum viable population needed to avoid extinction
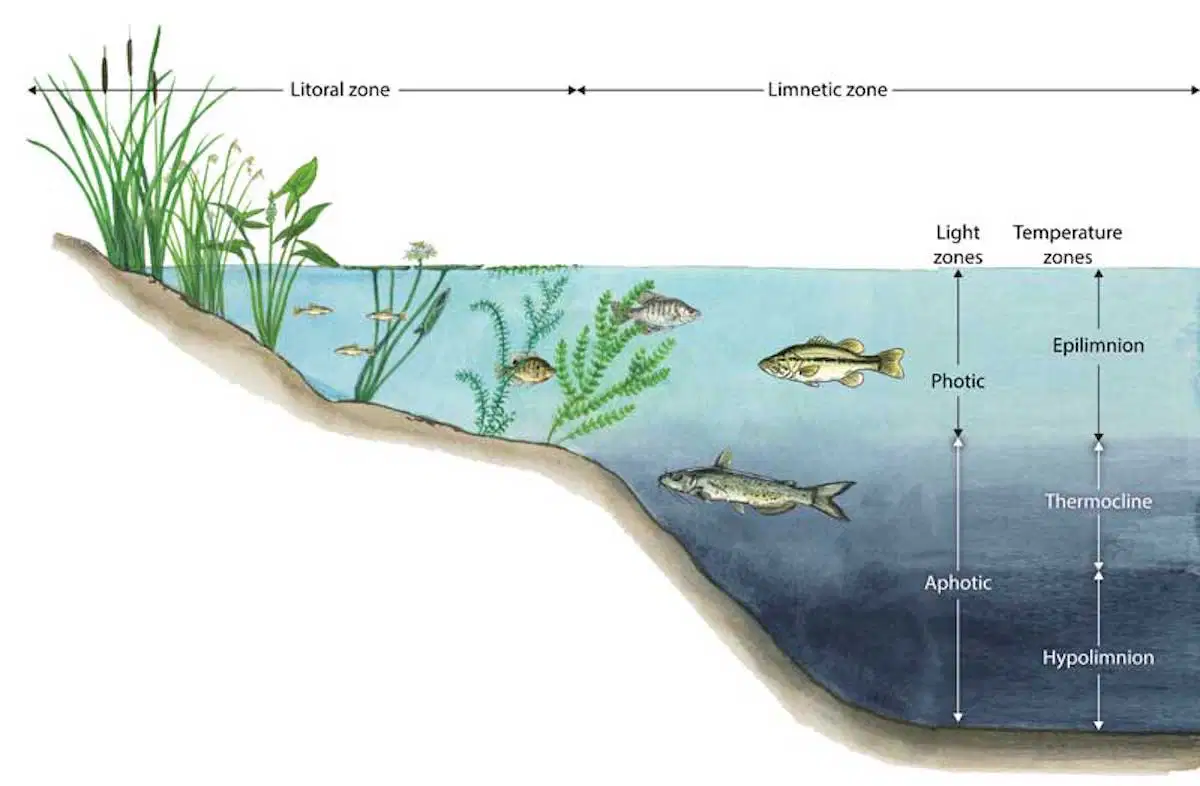
What is the profundal zone in a lake?
The deep, aphotic open-water zone below the photic layer with low oxygen
The shallow near-shore zone with rooted plants
The sunlit open-water zone away from shore
The bottom substrate where decomposers live exclusively
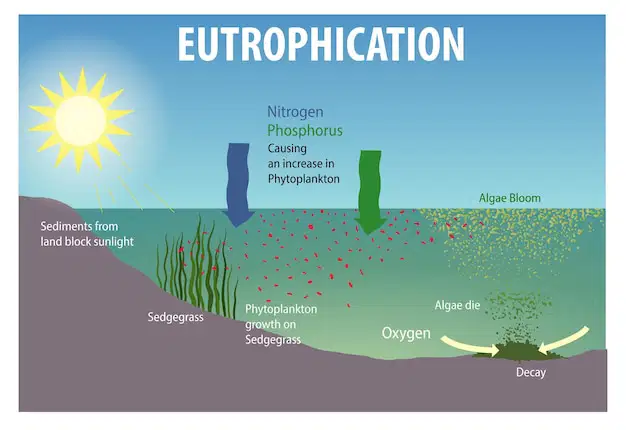
Describe eutrophication in aquatic ecosystems.
Nutrient enrichment that fuels algal blooms, followed by decomposition and oxygen depletion
Sediment removal that clears water and increases oxygen
Rapid cooling of surface waters that traps oxygen at depth
Invasion by predators that reduce algal levels and raise oxygen

What primary factors shape global biome distribution?
Patterns of temperature and precipitation over time
Soil pH alone
Plate tectonics and earthquake frequency
Latitude alone without regard to moisture
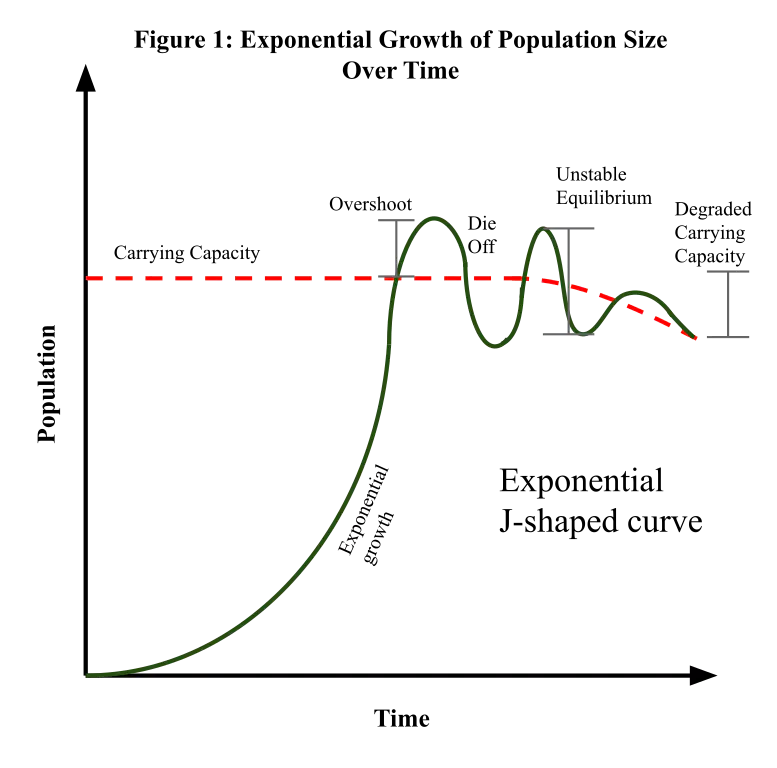
Based on a logistic growth curve, what typically happens after a population overshoots its carrying capacity?
The population declines due to resource limitation and then stabilizes near carrying capacity
The population continues increasing exponentially without limit
The population immediately goes extinct from overshoot effects
The population remains permanently at the overshoot level
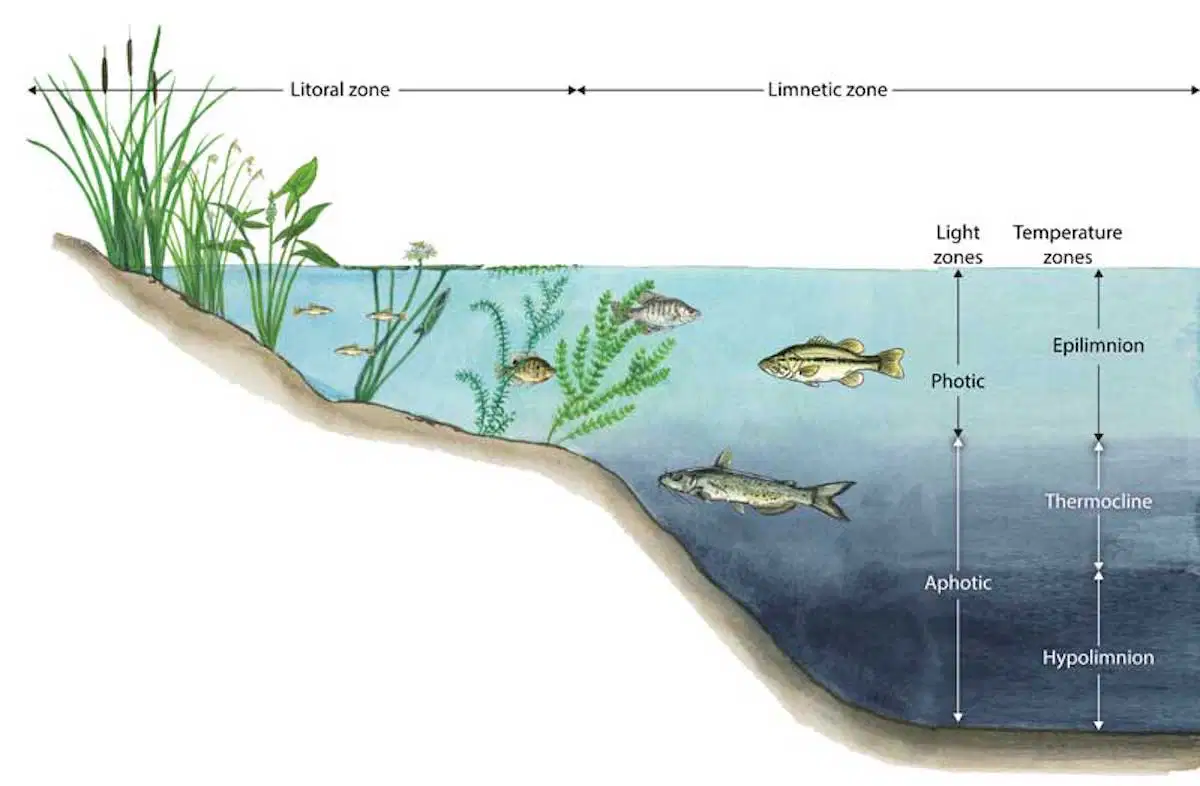
Which zone in a lake receives the most light?
Littoral zone
Limnetic zone
Profundal zone
Benthic zone

Why is biodiversity often highest in transitional river reaches?
They contain diverse habitats and mixing of resources, creating an ecotone with many niches
Uniform conditions limit specialization, so only one dominant species persists
Frequent scouring eliminates habitat complexity, reducing niches
Low nutrient inputs restrict primary productivity, lowering diversity
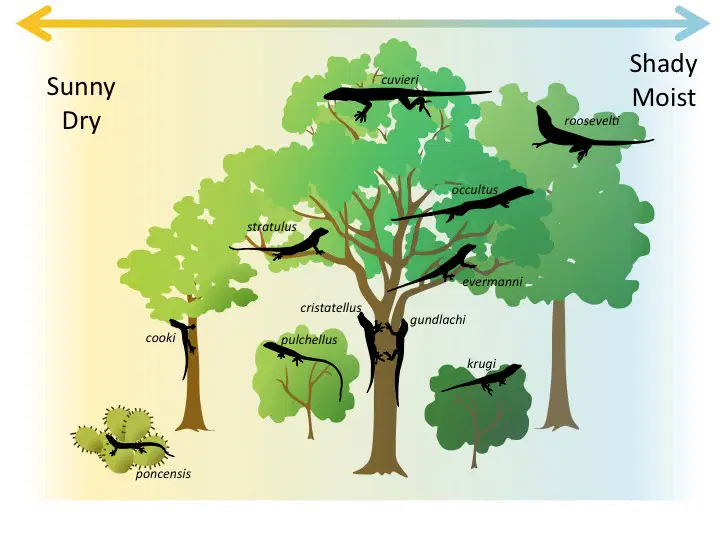
What is resource partitioning?
Species reduce direct competition by using different resources or using shared resources in different ways
Species with identical niches competitively exclude each other until only one remains
Organisms share resources equally regardless of niche
Species avoid competition by migrating to different biomes

Why does dissolved oxygen drop during eutrophication?
Bacterial decomposition of algal blooms consumes oxygen faster than it is replenished
Warmer water from eutrophication increases oxygen solubility and raises DO
Aquatic plants stop respiring at night, causing DO to spike
Increased water clarity reduces respiration rates, lowering DO

In a typical temperature versus latitude graph, how does average temperature change from the equator toward the poles?
It decreases with increasing latitude
It increases with increasing latitude
It remains constant across latitudes
It fluctuates randomly with no latitudinal pattern
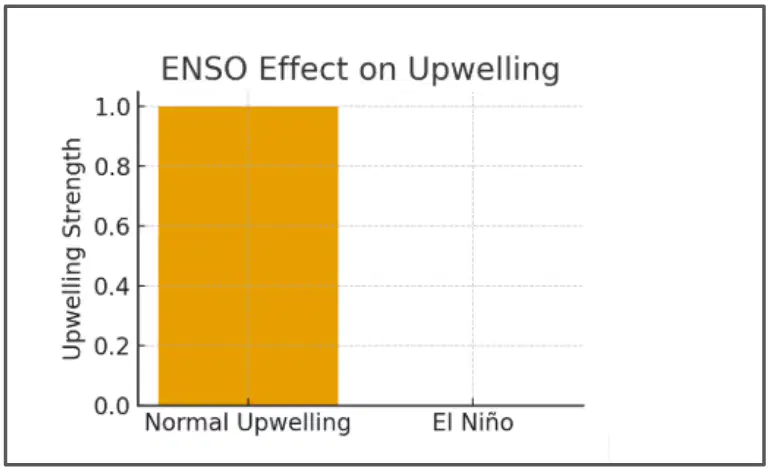
Based on an ENSO upwelling bar graph, what generally happens to coastal upwelling along the South American coast during El Niño compared with La Niña?
Upwelling weakens significantly during El Niño and strengthens during La Niña
Upwelling strengthens during El Niño and weakens during La Niña
Upwelling remains unchanged during both phases
Upwelling reverses to persistent downwelling during La Niña only
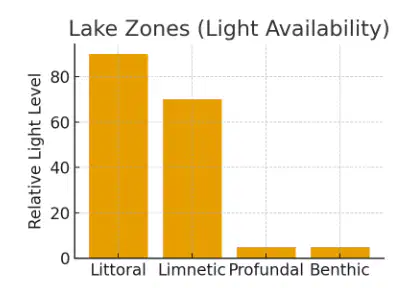
In a standard lake zonation diagram, which zone is the open-water region away from shore with sufficient light for photosynthesis?
Limnetic zone
Profundal zone
Benthic zone
Littoral zone
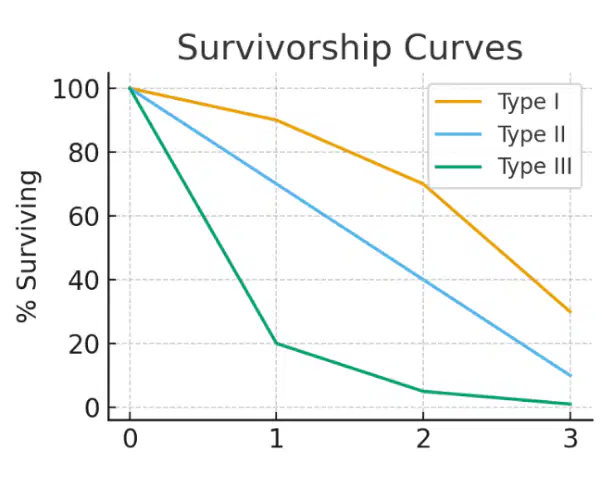
In a survivorship curve diagram, a curve with high survival through early and middle life followed by a steep decline in old age is which type?
Type I
Type II
Type III
Type IV
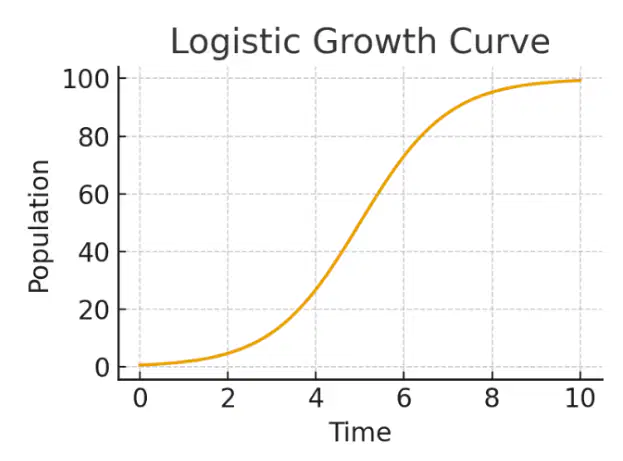
In a logistic growth diagram, which statement best describes the population trend shown?
Population growth slows as density increases and levels off near carrying capacity, forming an S-shaped curve
Population size doubles at a constant rate without limit, forming a J-shaped curve
Population fluctuates chaotically with no relationship to density
Population collapses to zero immediately after initial growth
What role does mutation play in evolution?
It introduces new genetic variation on which selection and drift can act
It eliminates variation by making all individuals identical
It directly causes individuals to adapt during their lifetimes
It only occurs in small populations and has no effect on evolution
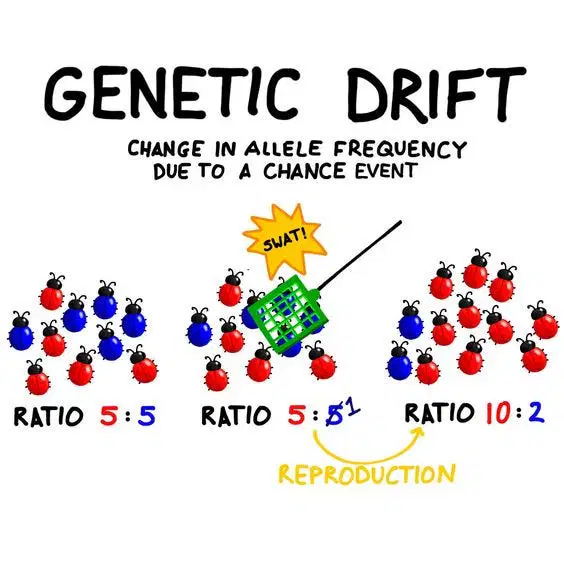
How does natural selection differ from genetic drift?
Selection is nonrandom survival and reproduction based on fitness; drift is random change in alleles, especially in small populations
Both are random processes that change traits without regard to fitness
Selection reduces adaptation while drift increases adaptation
Drift operates only in large populations, while selection operates only in small populations
Which of the following is an example of an adaptation?
Thick insulating fur in Arctic mammals that improves cold tolerance
A temporary suntan after summer exposure
Random coat-color variation with no effect on survival
Increased muscle size from exercise during an individual’s lifetime
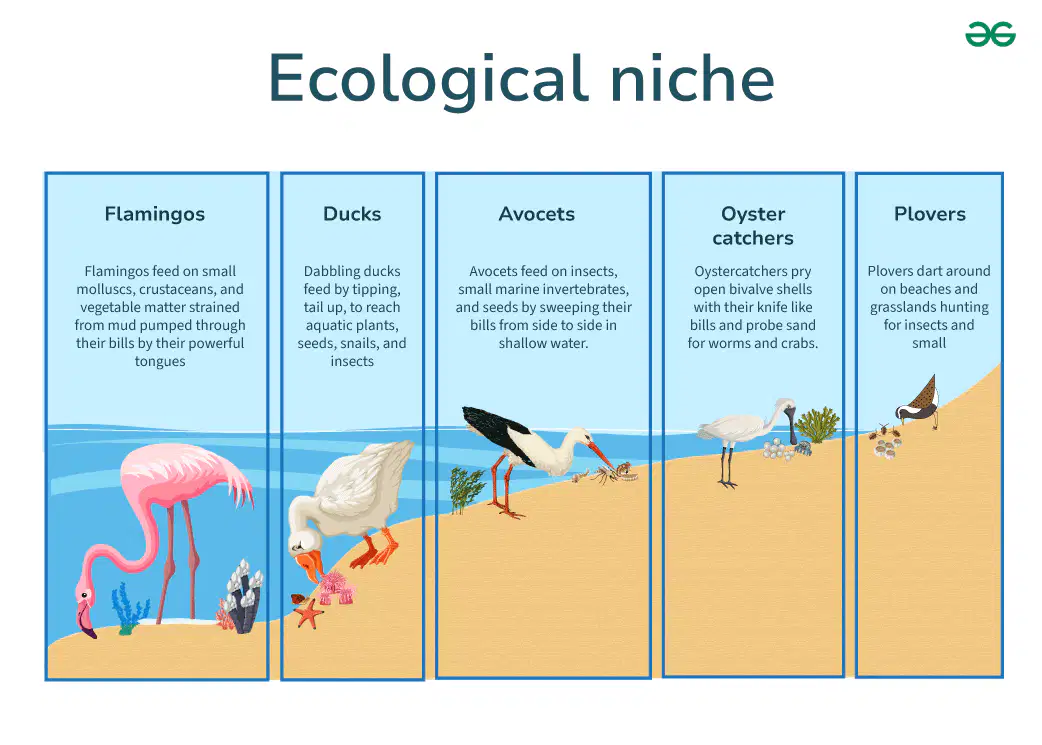
What is a niche in ecology?
The set of environmental conditions and resource-use patterns defining a species’ role in its ecosystem
The geographic area a species happens to occupy at the moment
Only the food a species eats, not its habitat or interactions
A temporary shelter used by individuals for resting
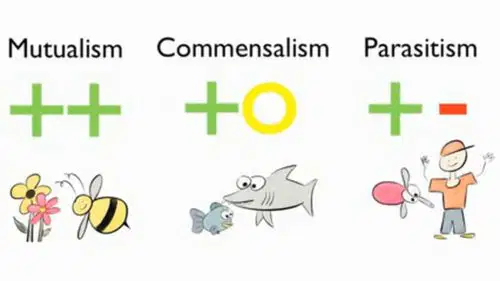
Which statement accurately compares mutualism and commensalism?
Mutualism benefits both species, whereas commensalism benefits one species with little to no effect on the other
Mutualism benefits one species and harms the other, whereas commensalism benefits both
Both mutualism and commensalism harm at least one species
Mutualism and commensalism are identical interactions with equal benefits for all participants
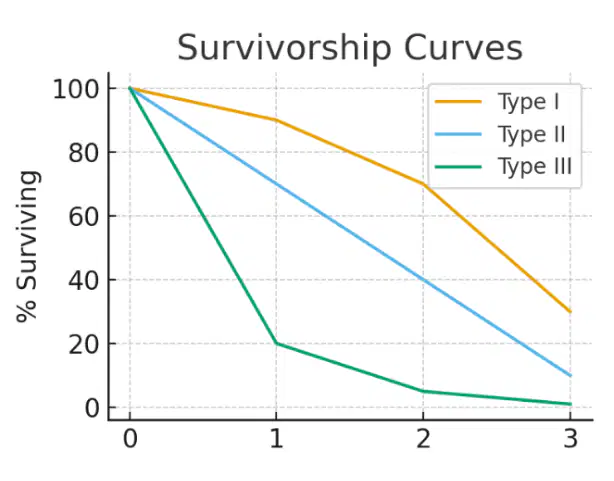
What does a Type II survivorship curve show about mortality across the lifespan?
A relatively constant mortality rate at all ages
High mortality early in life and low survival of juveniles
Low mortality in youth with a sharp increase in old age
Catastrophic mortality during early development followed by stable survival
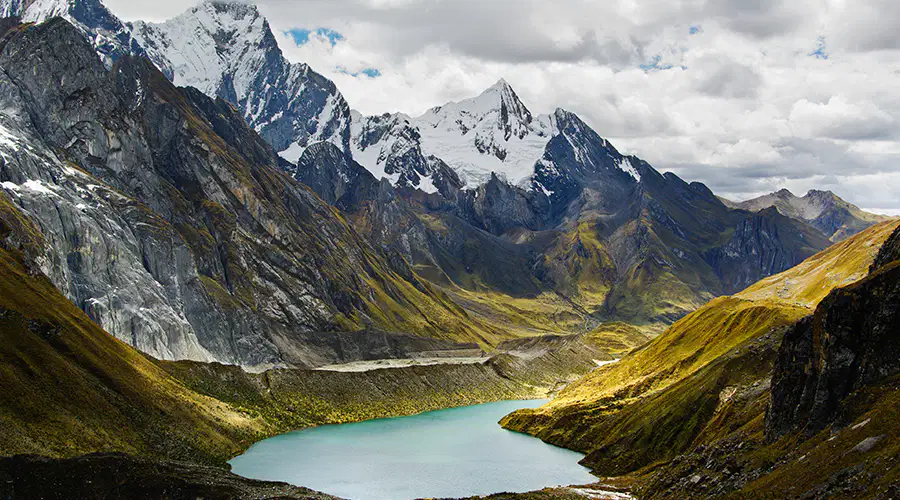
Climate & Biomes — Why is it colder at higher latitudes?
Solar energy arrives at a lower angle and is spread over a larger area, reducing heating
Earth is farther from the Sun during winter at high latitudes
There are more greenhouse gases near the poles that trap less heat
Geothermal heat is weaker far from the equator

Climate & Biomes — What conditions produce deserts?
Persistent descending dry air that warms as it compresses, often under subtropical high-pressure systems
Rising moist air that cools and condenses
Frequent cold fronts that bring snow
Continuous onshore flow of humid ocean air

Climate & Biomes — What is a climatograph used for?
To display monthly temperature and precipitation for a specific location
To measure wind speed every minute at multiple sites
To track earthquake magnitudes over time
To map tectonic plate boundaries

Aquatic Systems — Which zone of a lake has the least dissolved oxygen (DO)?
Littoral zone
Limnetic zone
Profundal zone
Benthic zone
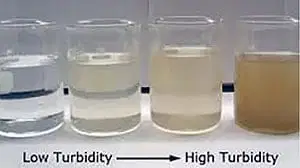
Aquatic Systems — Why does turbidity reduce photosynthesis?
Suspended particles scatter and block light from reaching producers
Turbidity adds nutrients that plants cannot use
Turbidity warms surface water and increases metabolism
Turbidity increases dissolved oxygen beyond saturation
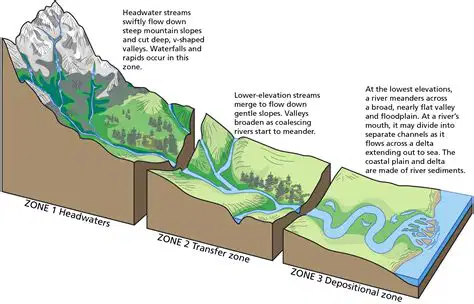
Aquatic Systems — What factors determine river biodiversity?
Flow regime, oxygen levels, and substrate complexity
Salinity gradients like those in oceans
Tidal amplitude and lunar cycles
Mountain elevation alone
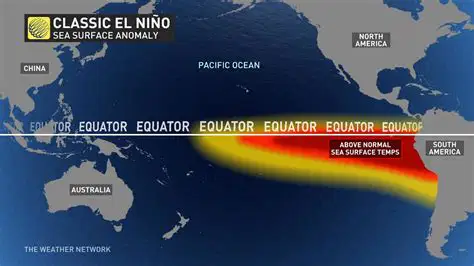
Marine Systems — Why does El Niño reduce upwelling?
Weakened or reversed trade winds reduce coastal Ekman transport and mixing
Stronger offshore winds enhance upwelling along coasts
Increased storm activity pulls deep water to the surface
Cooling sea-surface temperatures increase surface water density and sinking
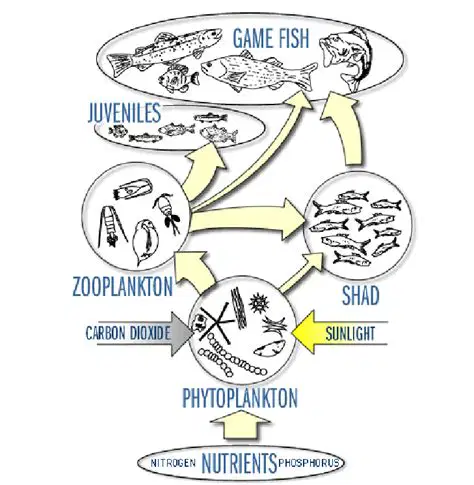
Marine Systems — What organisms rely on upwelling?
Phytoplankton and the fisheries that feed on them
Desert succulents far inland
Only large coral predators
Deep-sea vent communities exclusively

Marine Systems — What is the photic zone?
The upper layer of water where enough light penetrates for photosynthesis
A deep layer with maximum nutrients but no light
The zone of highest pressure near the seafloor
The intertidal splash zone only
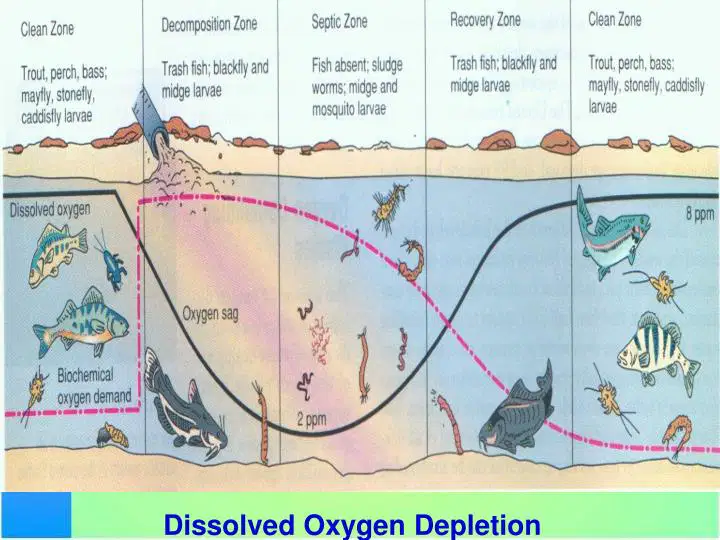
Human Impact — What human activities cause eutrophication?
Runoff of fertilizers and sewage that add excess nutrients to water
Overfishing that reduces predator populations
Selective logging in tropical forests only
Airborne dust that reflects sunlight
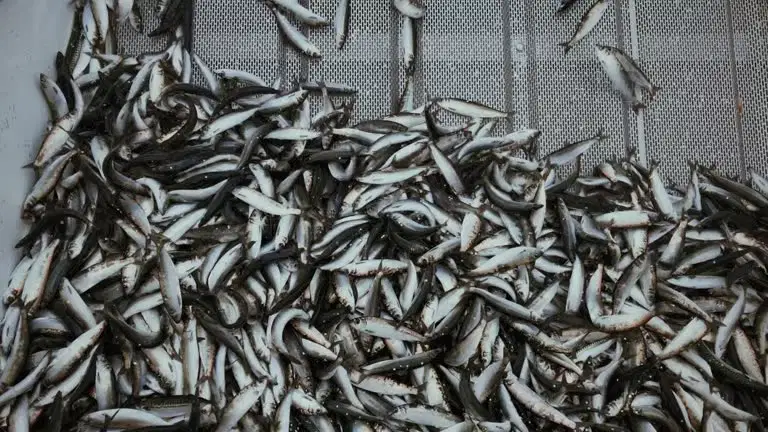
Human Impact — How does overfishing relate to the tragedy of the commons?
Individuals overuse a shared fishery for personal gain, leading to depletion for everyone
Private ownership of fish stocks prevents any overuse
Strict quotas eliminate the problem entirely
Overfishing raises the carrying capacity of the fishery
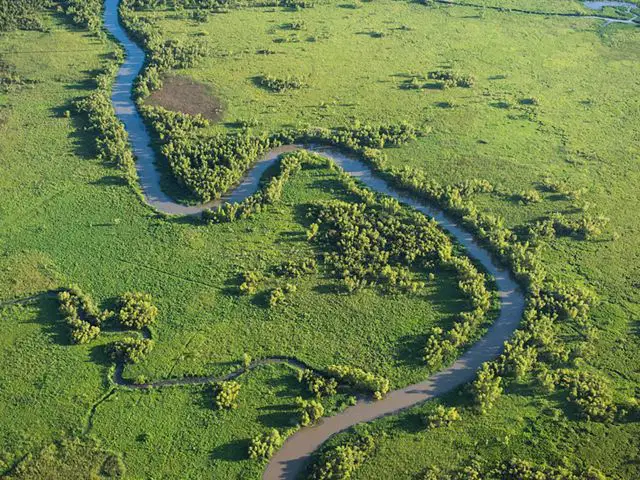
Human Impact — Why are wetlands important?
They provide habitat, filter water, and buffer floods and storms
They increase soil salinity and reduce biodiversity
They replace forests as a source of timber
They contribute to desertification on coasts
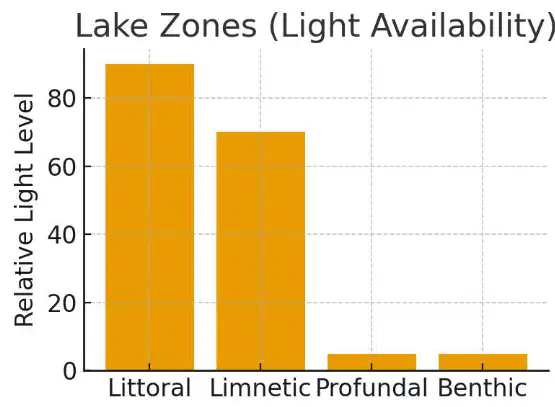
SECTION 4 — Diagram Labeling Activities: Lake Zones — Label Littoral, Limnetic, Profundal, Benthic. Based on the bar chart titled "Lake Zones (Light Availability)," match each lake zone with the relative light level shown in the diagram.
Littoral
Highest light near shore
Limnetic
Moderate to high light in open surface waters
Profundal
Very low light in deep water
Benthic
Low light at bottom sediments
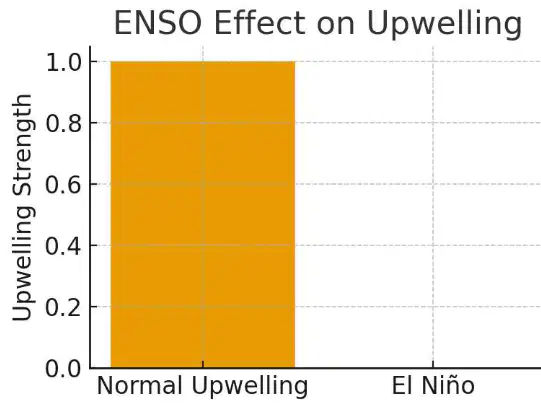
SECTION 4 — Diagram Labeling Activities: ENSO Upwelling — Label Normal vs El Niño conditions. According to the "ENSO Effect on Upwelling" chart, which condition shows strong coastal upwelling?
Normal upwelling conditions
El Niño conditions
Both conditions equally
Neither condition
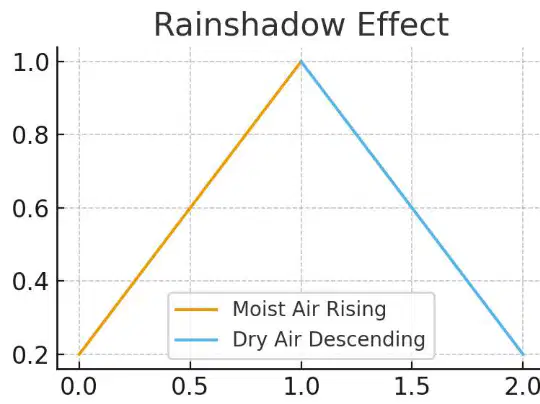
SECTION 4 — Diagram Labeling Activities: Rainshadow Effect — Label windward and leeward sides. In the diagram where moist air rises on one side of a mountain and dry air descends on the other, which side is the windward side?
The side where moist air rises and precipitation occurs
The side where dry air descends and a rain shadow forms
Both sides are windward
Neither side is windward
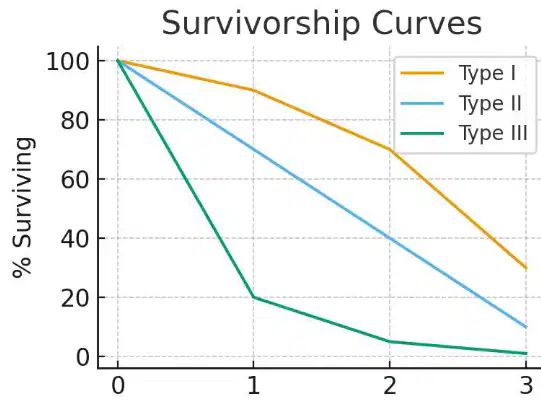
SECTION 4 — Survivorship Curves — Label Type I, II, III. In the survivorship curves diagram, which curve represents high survivorship through early life with a steep decline in old age?
Type I
Type II
Type III
None of the curves
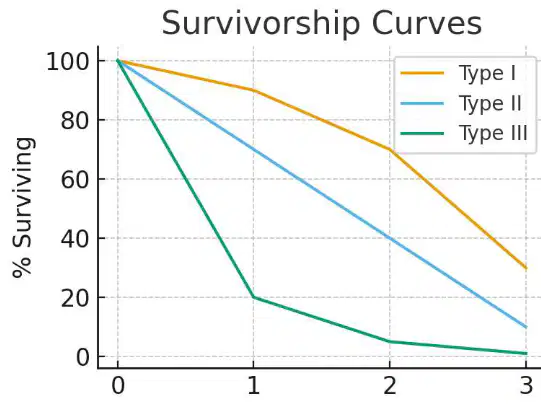
SECTION 4 — Survivorship Curves — Which curve shows a roughly constant mortality rate across the lifespan?
Type I
Type II
Type III
All types equally
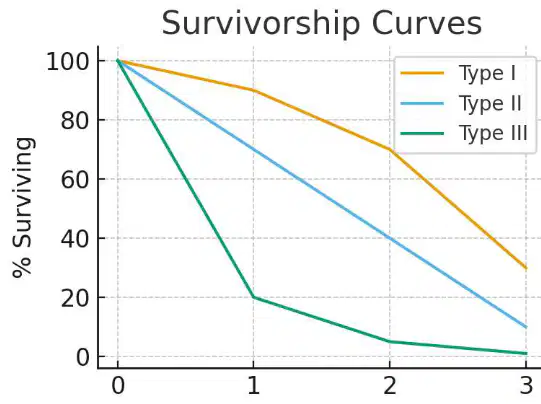
SECTION 4 — Survivorship Curves — Which curve shows very high juvenile mortality followed by low adult mortality?
Type I
Type II
Type III
None of the above
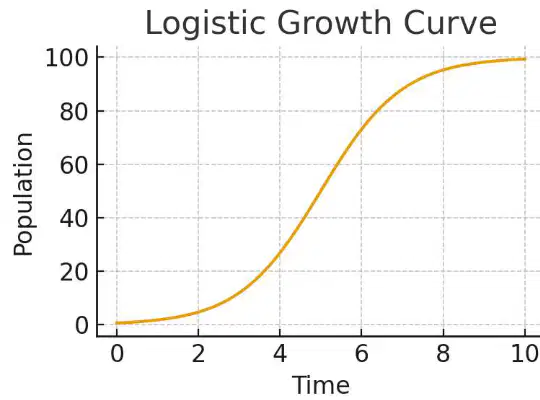
SECTION 4 — Logistic Curve — Label exponential phase, K, plateau. Match each term to its position or meaning on the Logistic Growth Curve diagram.
Exponential phase
Early steep increase when population grows rapidly at low density
K (carrying capacity)
Upper limit representing maximum sustainable population
Plateau near K
Later flattening of the curve as growth rate approaches zero near K
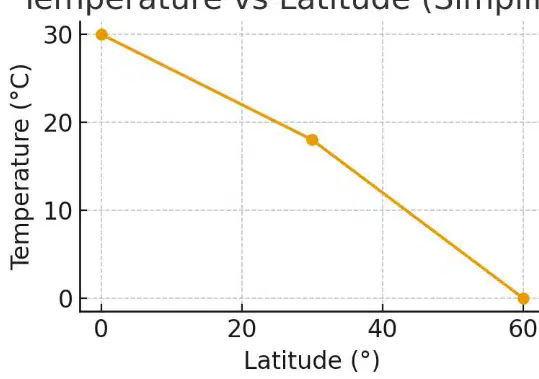
SECTION 4 — Latitude Graph — Label equator, mid-latitudes, poles. Match each location with its approximate latitude on the Temperature vs Latitude (Simplified) graph.
Equator
0° latitude
Mid-latitudes
Around 30°–40° latitude
Poles
60°+ latitude

