
 Worksheets
Motion, forces and energy — 1.2 Motion (Paper 1 and 2)
Total questions: 60
Worksheet time: 30mins
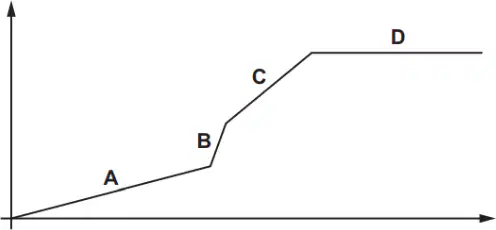
The diagram shows the speed–time graph of an object with labelled sections A, B, C and D. In which section does the object have the largest acceleration?
A
B
C
D
An object begins to fall close to the Earth’s surface. Air resistance can be ignored. Which statement about the object’s acceleration is correct?
The acceleration is constant.
The acceleration decreases as the body falls.
The acceleration increases as the body falls.
The acceleration is zero.
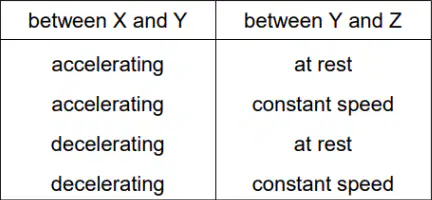
The diagram shows how the speed of a falling object changes with time. Points X, Y and Z are marked on the curve. Which row describes the motion of the object between X and Y, and between Y and Z?
between X and Y: accelerating; between Y and Z: at rest
between X and Y: accelerating; between Y and Z: constant speed
between X and Y: decelerating; between Y and Z: at rest
between X and Y: decelerating; between Y and Z: constant speed
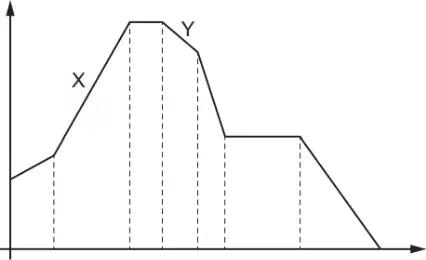
The speed–time graph represents a journey with sections labelled X and Y. How does the graph show that the distance travelled in section X of the journey is greater than the distance travelled in section Y?
The area under section X of the graph is greater than the area under section Y.
The gradient of section X of the graph is greater than the gradient of section Y.
The speed at the end of section X of the journey is greater than the speed at the end of section Y.
The time for section X of the journey is greater than the time for section Y.
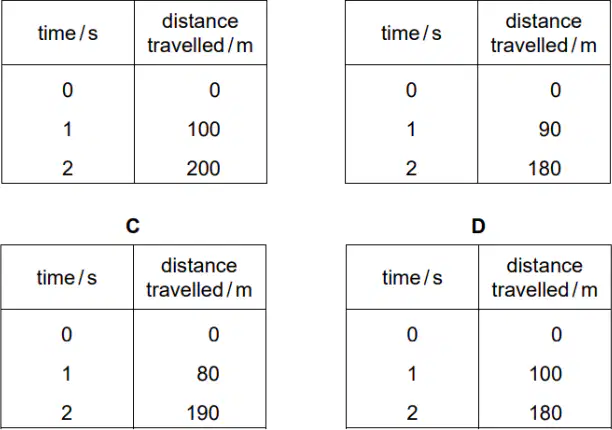
A racing car is fitted with an on-board computer. Every time the car passes the starting line, the computer records the distance travelled in the following two seconds. Which set of data shows that the car is increasing in speed during the two seconds?
A: time/s 0,1,2; distance/m 0,100,200
B: time/s 0,1,2; distance/m 0,90,180
C: time/s 0,1,2; distance/m 0,80,190
D: time/s 0,1,2; distance/m 0,100,180
Which row shows the gravitational field strength on the Earth and the definition of velocity?
A: 9.8 kg/N; the change in the speed
B: 9.8 N/kg; the change in the speed
C: 9.8 kg/N; the speed in a given direction
D: 9.8 N/kg; the speed in a given direction
The graph shows the speed of a car travelling through a town, with sections labelled A, B, C and D. Which section of the graph represents a period when the car is decelerating?
A
B
C
D
A student measures the average speed of a cyclist in a race. Which quantities must she measure?
the total time taken to complete the race and the time taken for the cyclist to reach her highest speed
the total time taken to complete the race and the total distance travelled by the cyclist at her highest speed
the total time taken to complete the race and the total distance travelled by the cyclist
the time taken to reach her highest speed and the total distance travelled by the cyclist
The graph shows the motion of a sprinter. She accelerates steadily from rest to 8.0 m/s in 4.0 s. How far does she travel in the last three seconds of her acceleration?
9.0 m
15 m
16 m
24 m
The graph represents the motion of a vehicle. What is the distance travelled by the vehicle in 400 s?
20 m
400 m
4000 m
8000 m
The diagram shows a distance–time graph for an object moving in a straight line. What is the average speed between X and Y?
0.20 m/s
0.30 m/s
0.40 m/s
0.60 m/s
The speed–time graph represents a short journey. Which distance–time graph represents the same journey?
A
B
C
D
The graph represents the motion of a car. How far has the car moved between 0 and 5 s?
2 m
10 m
25 m
50 m
A car starts from rest. The table shows the readings from its speedometer every 10 s. Which row describes the car’s motion in the first 30 seconds and in the last 30 seconds?
non-zero acceleration; at rest
zero acceleration; constant speed
zero acceleration; at rest
non-zero acceleration; constant speed
The diagrams show speed–time graphs for four different bodies moving for 6.0 s. Which body travelled the least distance?
A
B
C
D
The speed–time graph for a train is shown. Which regions of the graph show the train moving?
P, Q, R and S
Q, R and S only
Q and S only
R only
A man stands next to a railway track. A train travelling at 40 m/s takes 2.0 s to pass the man. What is the length of the train?
20 m
38 m
40 m
80 m
What is used to determine the distance travelled by an object in motion?
the area under a distance–time graph
the area under a speed–time graph
the gradient of a distance–time graph
the gradient of a speed–time graph
The diagrams show distance–time graphs for four objects. Which graph represents an object moving with an increasing speed?
A
B
C
D
Which graph represents an object that is moving at constant speed?
Graph A: distance–time graph is a horizontal line (distance constant).
Graph B: distance–time graph curves upward (distance increases more rapidly with time).
Graph C: distance–time graph is a straight line with positive slope (distance increases uniformly with time).
Graph D: distance–time graph is a straight line with negative slope (distance decreases uniformly with time).
Two stones of different weights fall at the same time from a table. Air resistance may be ignored. What will happen and why?
Both stones hit the floor at the same time; acceleration of free fall is constant.
Both stones hit the floor at the same time; they fall at constant speed.
The heavier stone hits the floor first; acceleration increases with weight.
The heavier stone hits the floor first; speed increases with weight.
The distance–time graph for a motorway journey is shown. What is the average speed for the journey?
50 km/h
67 km/h
70 km/h
83 km/h
A cyclist records his speed and the distance travelled during a journey. He then plots the data against time for different sections of his journey. Which graph shows a section when he is moving with constant speed?
Graph A: distance–time horizontal line (distance constant).
Graph B: speed–time straight line increasing with time.
Graph C: distance–time straight line with constant positive slope.
Graph D: speed–time straight line decreasing with time.
A boy throws a ball vertically upwards with a speed v . Which row describes the speed and the acceleration of the ball at point X on the way upwards?
Speed decreasing; acceleration upwards.
Speed decreasing; acceleration downwards.
Speed increasing; acceleration upwards.
Speed increasing; acceleration downwards.
A car driver measures the time taken to complete four separate journeys. In which journey does the driver have the greatest average speed?
Journey A: distance 60 km, time 2 h.
Journey B: distance 60 km, time 3 h.
Journey C: distance 120 km, time 3 h.
Journey D: distance 120 km, time 4 h.
The graph shows how the speed of an object varies with time. Which row describes the motion of the object at times P and Q?
P at rest; Q accelerating.
P at rest; Q decelerating.
P moving with constant speed; Q accelerating.
P moving with constant speed; Q decelerating.
The motion of an object is represented by the speed–time graph shown. Which quantity is equal to the area under the graph?
acceleration
average speed
distance travelled
kinetic energy
Which statement about acceleration is correct?
It is related to the changing speed of an object.
It is the distance an object travels in one second.
It is the force acting on an object divided by the distance it travels in one second.
It is the force acting on an object when it is near to the Earth.
The graph shows how the speed of an object varies with time. At which labelled time is the acceleration greatest?
A
B
C
D
Which statement about acceleration is correct?
It is related to the changing speed of an object.
It is the distance an object travels in one second.
It is the force acting on an object divided by the distance it travels in one second.
It is the force acting on an object when it is near to the Earth.
The graph shows how the speed of an object changes with time. How far does the object travel in 10 seconds?
8 m
10 m
40 m
80 m
The graph shows the motion of a car for a five-second period. Which row is correct?
the car is at rest at 0.0 s; the car is moving at a constant speed at 2.0 s
the car is at rest at 0.0 s; the car is moving at a constant speed at 4.0 s
the car is at rest at 4.0 s; the car is moving at a constant speed at 0.0 s
the car is at rest at 4.0 s; the car is moving at a constant speed at 2.0 s
A long-distance runner wishes to calculate her average speed for a race. Which calculation should she use?
average speed = total distance ÷ total time
average speed = total distance × total time
average speed = total time ÷ total distance
average speed = total distance + total time
A car travels at an average speed of 60 km/h for 15 minutes. How far does the car travel in 15 minutes?
4.0 km
15 km
240 km
900 km
A heavy metal ball falls vertically downwards through air past four equally spaced levels J, K, L and M. The times taken to fall from one level to the next are measured. Where is the speed of the ball greatest and which time is shortest?
speed is greatest between J and K; time is shortest between J and K
speed is greatest between J and K; time is shortest between L and M
speed is greatest between L and M; time is shortest between J and K
speed is greatest between L and M; time is shortest between L and M
A car travels at constant speed. Which pair of graphs show how the distance travelled by the car and how the car’s speed vary with time?
pair A
pair B
pair C
pair D
The graph shows how the speed of an object varies with time. At which point on the graph is the greatest distance travelled per second?
A
B
C
D
An athlete runs at a speed of 8 m/s for 10 s, and then at a speed of 6 m/s for 12 s. Which calculation gives the average speed of the athlete in m/s?
(8 + 6) ÷ 2
((8 × 10) + (6 × 12)) ÷ 22
(8 ÷ 10) + (6 ÷ 12) ÷ 22
(10 ÷ 8) + (12 ÷ 6) ÷ 22
A runner runs 300 m at an average speed of 3.0 m/s. She then runs another 300 m at an average speed of 6.0 m/s. What is her average speed for the total distance of 600 m?
2.0 m/s
4.0 m/s
4.5 m/s
8.0 m/s
A car is moving along a straight, level road, with a constant acceleration. Which graph shows the motion of the car?
A
B
C
D
A car takes 15 minutes to travel along a road that is 20 km long. What is the average speed of the car?
0.75 km/h
5.0 km/h
80 km/h
300 km/h
A rocket travels with an average speed of 6 km/s for 2 minutes. What is the distance travelled by the rocket?
12 km
50 km
720 km
12 000 km
A coconut falls from a palm tree. At X, it has just started falling. Y is the point just before it hits the ground. What is the acceleration of the coconut at X? (Air resistance can be ignored.)
zero
less than that at Y
the same as that at Y
more than that at Y
A boy takes 30 minutes to cycle a distance of 8.0 km. He then walks a further distance of 2.0 km in 15 minutes. What is his average speed?
4.5 km/h
5.6 km/h
12 km/h
13 km/h
A small, light ball is dropped from the top of a tall building. (extended only) Which graph shows how the speed of the ball changes with time?
A
B
C
D
An object reaches terminal velocity after being dropped and falling through air. (extended only) Which graph shows how its speed varies with time?
A
B
C
D
The diagram shows a series of images of a moving object taken at regular intervals. The object is moving from left to right. Which statement describes the motion of the object?
The object accelerates continuously.
The object decelerates continuously.
The object travels at constant speed and then accelerates.
The object travels at constant speed and then decelerates.
A light ball is held at rest at the top of a tall cliff. It is released and falls through the air, eventually reaching its terminal velocity. Which row describes the behaviour of the ball as it descends? (extended only)
A
B
C
D
A speed–time graph is used to describe the motion of an object. Which quantities are calculated from the gradient of the graph and from the area under the graph?
acceleration; distance travelled
acceleration; total journey time
distance travelled; acceleration
total journey time; distance travelled
Which quantity is equal to acceleration?
area under a distance–time graph
area under a speed–time graph
gradient of a distance–time graph
gradient of a speed–time graph
A concrete block falls vertically from an aeroplane. The concrete block falls into the sea and sinks. Which graph shows the vertical motion of the concrete block?
A
B
C
D
A car is travelling at a velocity of 2.0 m/s . It accelerates at a constant 0.20 m/s2 for 2.5 minutes . What is the final velocity of the car?
2.5 m/s
5.2 m/s
30 m/s
32 m/s
A student investigates the motion of a ball rolling down a slope. The diagram shows the speed v of the ball at different times t ( t=0 s, v=0 cm/s; t=0.2 s, v=2.8 cm/s; t=0.4 s, v=5.1 cm/s; t=0.6 s, v=7.0 cm/s ). Which statement describes the motion of the ball?
The acceleration is not constant.
The acceleration is negative.
The speed is decreasing.
The velocity is constant.
Which statement about acceleration is correct?
It is related to the changing speed of an object.
It is the distance an object travels in one second.
It is the force acting on an object divided by the distance it travels in one second.
It is the force acting on an object when it is near to the Earth.
A light object is dropped from rest. It falls a large distance vertically through air. How can the motion of the object be described?
constant acceleration
increasing acceleration
decreasing acceleration and then moving at terminal velocity
increasing acceleration and then moving at terminal velocity
The graph shows how the speed of a car varies during part of a journey. What is the acceleration of the car between 6.0 s and 10.0 s ?
0.50 m/s2
0.80 m/s2
1.25 m/s2
1.50 m/s2
The velocity of an object increases from 30 m/s to 50 m/s in 5.0 s . What is the average acceleration of the object?
0.10 m/s2
0.25 m/s2
4.0 m/s2
10 m/s2
The speed–time graph shows the motion of a car. At which time is its acceleration greatest?
A
B
C
D
Four objects are moving along a straight line. The distance of an object from a fixed point on the line is plotted against time for each object. Which object is decelerating?
A
B
C
D
When does an object falling vertically through the air reach terminal velocity?
when the acceleration of the object becomes negative
when the acceleration of the object is equal to g
when the air resistance equals the weight of the object
when the air resistance is greater than the weight of the object

