
 Worksheets
Unit 1: Science Skills Study Guide — Worksheet Questions
Total questions: 67
Worksheet time: 34mins
Matter: anything that has ____ and ____.
mass and volume
energy and motion
size and shape
weight and temperature
Matter: if it's not matter, it's ____!
energy
nothingness
a vacuum
force
Phases of matter — solid: atoms have ____ energy and are ____ together.
low energy and tightly packed
high energy and far apart
medium energy and sliding
zero energy and fixed
Phases of matter — liquid: atoms have ____ energy and ____ around each other.
medium energy and slide
low energy and stay fixed
high energy and spread far apart
zero energy and vibrate
Phases of matter — gas: atoms have ____ energy and are ____ from each other.
high energy and far apart
low energy and tightly packed
medium energy and sliding past
zero energy and fixed
Classify as matter or not matter: air.
Matter
Not matter
Classify as matter or not matter: eraser.
Matter
Not matter
Classify as matter or not matter: clouds.
Matter
Not matter
Classify as matter or not matter: heat.
Matter
Not matter
Classify as matter or not matter: light.
Matter
Not matter
Classify as matter or not matter: DNA.
Matter
Not matter
Classify as matter or not matter: sound.
Matter
Not matter
Classify as matter or not matter: water.
Matter
Not matter
Significant figures: indicates the ____ and accuracy of a measuring tool.
precision
reliability
speed
capacity
Our measurement cannot be more accurate than our tool.
True
False
Which digits always count toward significant figures?
All non-zero digits
Only zeros
Only even digits
Digits shown in scientific notation only
Which zeros NEVER count toward significant figures?
Leading zeros
Trailing zeros with a decimal point
Zeros between non-zero digits
Zeros in the coefficient of scientific notation
Trailing zeros count toward significant figures ____.
only when a decimal point is present anywhere in the number
never
always
only in scientific notation
Count the number of significant figures in 0.0450 .
2
3
4
5
Count the number of significant figures in 0.04600 .
2
3
4
5
Count the number of significant figures in 26000 .
2
3
4
5
Count the number of significant figures in 10450 .
3
4
5
6
Count the number of significant figures in 0.278 .
2
3
4
5
Count the number of significant figures in 5.20×10³ .
2
3
4
5
Scientific notation: useful for very ____ or very ____ numbers.
large; small
accurate; approximate
positive; negative
odd; even
Put this number INTO scientific notation: 45,000 .
4.5×10⁴
45×103
0.45×10⁵
4.5×10⁵
Put this number INTO scientific notation: 0.0000008 .
8×10⁻⁷
8×10⁻⁶
8.0×10⁻⁸
0.8×10⁻⁶
Put this number INTO scientific notation: 602,000,000 .
6.02×10⁸
6.02×10⁷
60.2×10⁷
0.602×10⁹
Put this number INTO scientific notation: 58,000 .
5.8×10⁴
58×103
0.58×10⁵
5.8×10⁵
Put this number INTO scientific notation: 0.00189 .
1.89×10⁻³
1.89×10⁻⁴
0.189×10⁻²
18.9×10⁻⁴
Put this number INTO scientific notation: 200 .
2×10²
20×101
0.2×10³
2.00×101
Take this number OUT of scientific notation: 6.7×10² .
670
0.067
6.7
67
Take this number OUT of scientific notation: 9.1×101 .
91
9.1
0.091
910
Take this number OUT of scientific notation: 2.8×10⁻⁴ .
0.00028
0.028
0.000048
0.0028
CER: "C" stands for ____.
Claim
Conclusion
Calculation
Commentary
CER — the claim includes ____ sentence with no ____ or explanation.
one; evidence
two; math
one; vocabulary
three; reasoning
CER: "E" stands for ____.
Evidence
Example
Experiment
Evaluation
CER — evidence includes the ____ I made to support my claim; I will include ALL of my ____ and ____ in complete sentences.
observations; data; results
opinions; thoughts; ideas
definitions; formulas; rules
questions; hypotheses; predictions
CER: "R" stands for ____.
Reasoning
Reflection
Replication
Reference
CER — reasoning includes an explanation that ____ supports my claim; I will use the ____ and scientific facts learned in class.
logically; evidence
briefly; questions
loosely; vocabulary
numerically; formulas
Used for PERCENTAGE data.
Pie chart
Bar graph
Line graph
Scatter plot
Bar graph used when the data is _____ or there is a _____ of measurements.
categorical or a comparison
continuous or a trend
percentages or proportions
paired variables or correlation
Used for CHANGE OVER TIME.
Line graph
Bar graph
Pie chart
Histogram
Used to determine the relationship between variables.
Scatter plot
Pie chart
Line graph
Pictograph
Graphing requirement: _____ at the top.
Title
Legend
Scale
Axis
Graphing requirement: _____ for the x-axis INCLUDING units.
Label
Caption
Trendline
Origin
Graphing requirement: Label for y-axis INCLUDING _____.
units
gridlines
data source
tick marks
Graphing requirement: Number lines/scales are _____ in intervals.
evenly spaced
logarithmic
random
uneven
Graphing requirement: _____ plotted correctly.
Data points
Equations
Titles
Paragraphs
Graphing requirement: _____ if more than 1 variable.
Key/legend
Hypothesis
Conclusion
Annotation
The more markings on a tool, the more _____ it measures & the more _____ you should have in your measurement.
precise; significant digits
accurate; units
precise; decimal places only
accurate; whole numbers
Read a graduated cylinder at the _____ of the meniscus.
bottom
top
middle
highest point
Figure out the scaling of your tool, then make sure your measurement is ALWAYS _____ more digit than that.
one
two
zero
three
If the tool markings go by ones, my measurement should go to what place?
tenths
hundredths
ones only
thousandths
If the tool markings go by tenths, my measurement should go to what place?
hundredths
tenths only
ones
thousandths

Measure with the correct sig figs: a ruler marked in 1-cm increments shows an object ending between 3 and 4 cm. What is the best-recorded length?
3.6 cm
3.0 cm
4 cm
3.60 cm
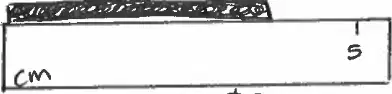
Measure with the correct sig figs: a ruler marked in 1-cm increments shows an object ending exactly at 5 cm. What is the best-recorded length?
5.0 cm
5 cm
5.00 cm
4.9 cm

Measure with the correct sig figs: a graduated cylinder with 1 mL scale shows the level between 1 mL and 2 mL. To what place value should you record the volume?
tenths of a milliliter
whole milliliters only
hundredths of a milliliter
nearest half milliliter

Measure with the correct sig figs: a graduated cylinder with 1 mL scale shows the level between 2 mL and 3 mL. To what place value should you record the volume?
tenths of a milliliter
ones of a milliliter
hundredths of a milliliter
nearest 2 mL
Steps of the Scientific Method: Which sequence is correct?
Ask a question → Conduct research → Experiment → Analyze data → Share results
Experiment → Conduct research → Ask a question → Share results → Analyze data
Ask a question → Experiment → Conduct research → Share results → Analyze data
Conduct research → Ask a question → Share results → Analyze data → Experiment
A _____ is a possible explanation for a set of observations; it is usually in an "if…then" form.
hypothesis
law
theory
variable
Control group vs. experimental group: Which statement is correct?
The control group does not get the special treatment; the experimental group does
The control group gets the special treatment; the experimental group does not
Both groups receive identical special treatments
Neither group is part of the experiment
Independent variable: What is it?
The variable the experimenter is in control of
What is being measured during the experiment
A possible explanation for results
A constant that never changes
Dependent variable: What is it?
What is being measured during the experiment
The variable the experimenter controls
A prediction stated in if–then form
A qualitative observation
Qualitative data vs. quantitative data: Which pairing is correct?
Qualitative is descriptive; quantitative is measurements
Qualitative is numerical; quantitative is descriptive
Both are strictly numerical
Both are strictly descriptive
In D=m/V , what does D stand for?
density
distance
displacement
diameter
To find volume through the displacement method, you determine volume by measuring the _____ change in a graduated cylinder after submerging the object.
water level
mass
temperature
color

