
 Worksheets
DataAnalyticsModule4
Total questions: 250
Worksheet time: 2hrs 5mins
Which of the following is NOT a benefit of data modelling as mentioned in the material?
Accuracy in results
Faster queries and refresh
Increased data redundancy
Easier maintenance & scalability
Why is raw data not ready for reporting, according to the material?
Raw data is always accurate
Raw data is already formatted for reports
Raw data needs to be modelled to ensure accuracy and usability
Raw data is only used for backups
Which of the following tasks is simplified by data modelling?
Report building
Data deletion
Hardware installation
Software licensing
What is the primary purpose of a schema in data modeling?
To define the logical structure of how tables are related
To store raw data only
To create visualizations
To manage user permissions
How does a schema influence Power BI?
It shapes how Power BI understands and processes data
It determines the color scheme of reports
It controls the export options
It sets the default language
What is the role of dimension tables in a schema?
To provide descriptive attributes
To store only numerical data
To manage database security
To generate random data
Which of the following is a benefit of having a good schema in data management?
Increases data redundancy
Simplifies complex datasets
Makes queries slower
Limits analysis flexibility
Which of the following is NOT listed as a benefit of good schemas?
Reduces ambiguity in relationships
Improves query performance
Increases data duplication
Provides flexibility for analysis
A company wants to design a data warehouse that is simple and efficient for querying. Based on best practices, which schema should they choose and why?
Star Schema, because it is simple and efficient
Snowflake Schema, because it is more complex
Star Schema, because it uses normalized dimensions
Snowflake Schema, because it avoids central fact tables
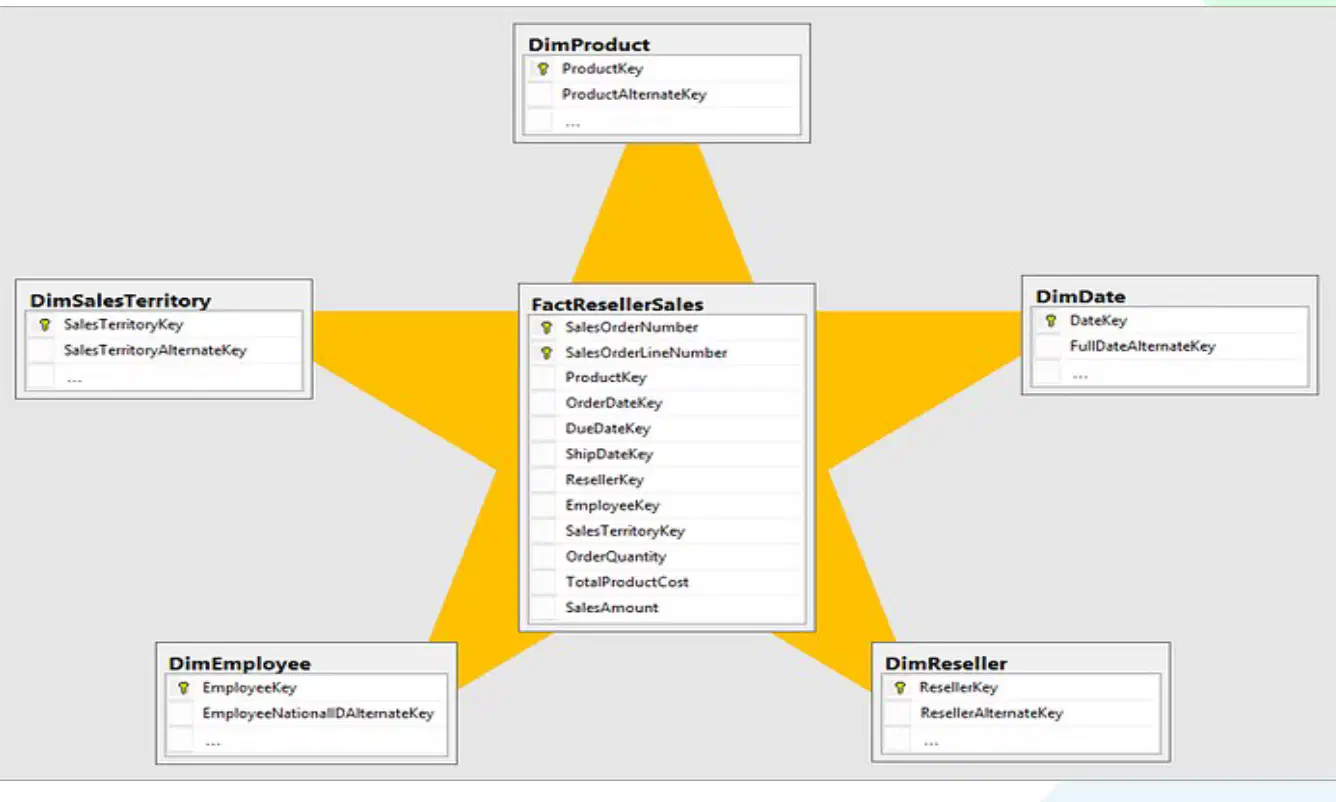
Which table in the diagram is most likely to be the fact table in a star schema?
FactResellerSales
DimProduct
DimDate
DimEmployee
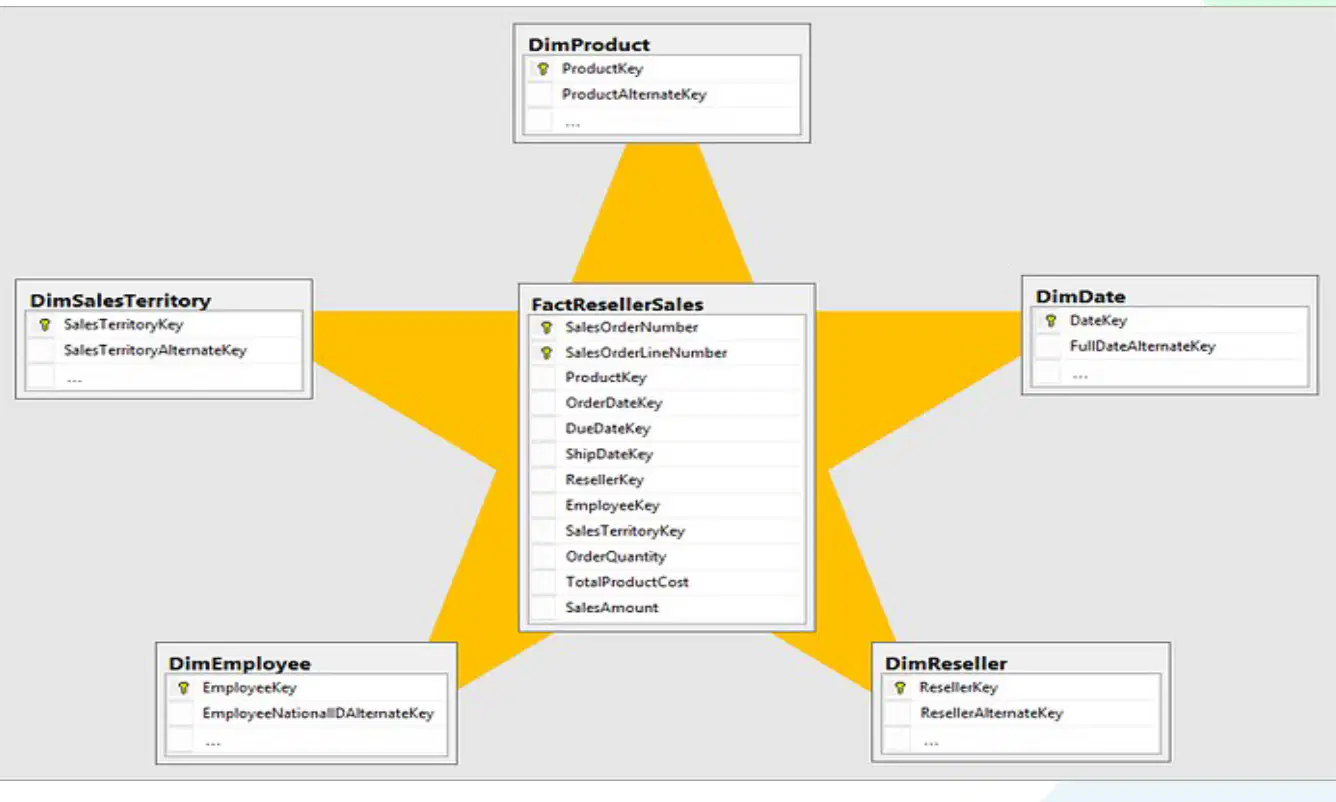
Which of the following is a dimension table in the provided star schema diagram?
FactResellerSales
DimProduct
SalesAmount
OrderQuantity
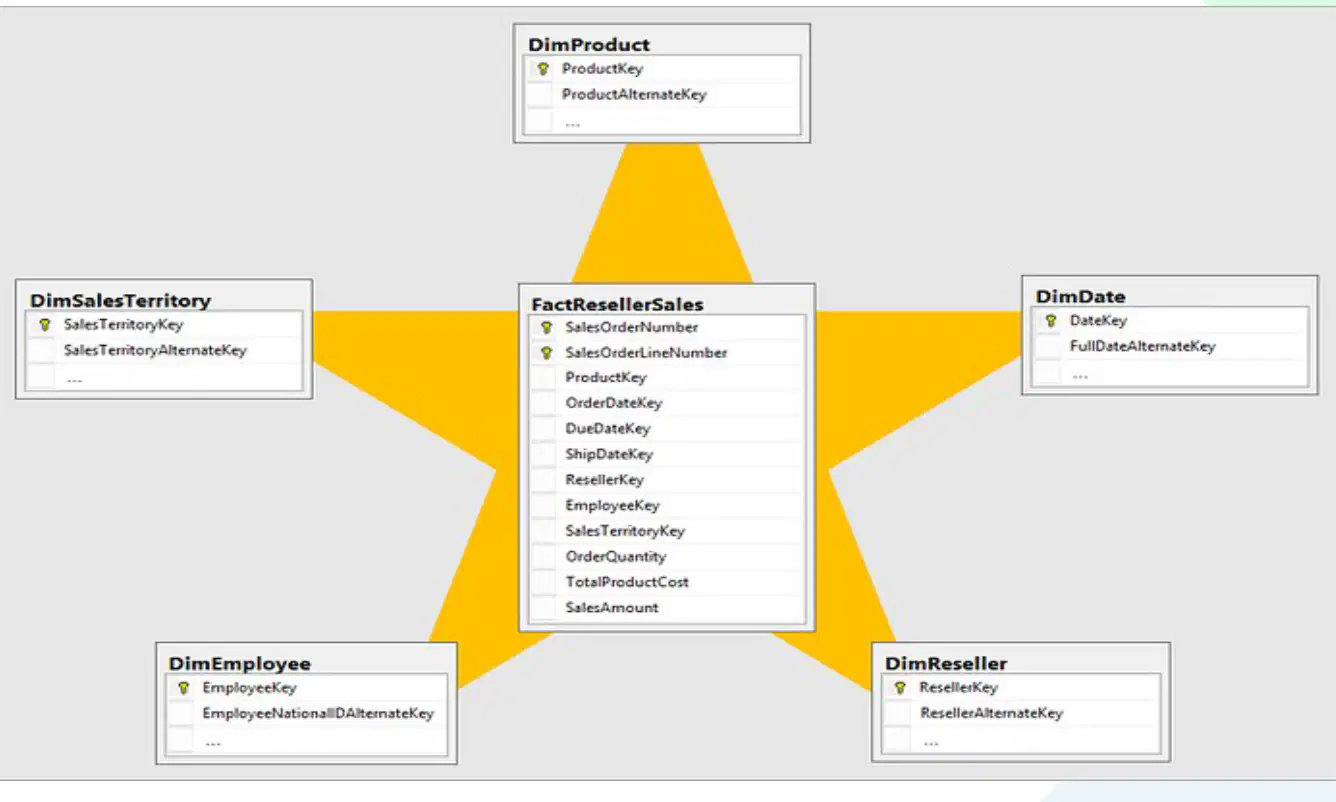
Suppose you need to find the total sales amount for each reseller. Which keys would you use to join the relevant tables?
ProductKey and EmployeeKey
ResellerKey and SalesOrderNumber
ResellerKey and ResellerAlternateKey
DateKey and OrderDateKey
What is a drawback of using the Snowflake Schema?
A. Fewer joins, faster queries
B. More joins, slower queries
C. No relationship propagation issues
D. Simplified data structure
When is it most appropriate to use a Snowflake Schema?
A. When report optimization is needed
B. When data storage optimization is needed
C. When minimizing joins is important
D. When denormalization is required
Which of the following is NOT a drawback of the Snowflake Schema?
A. More joins lead to slower queries
B. Relationship propagation issues
C. Data storage optimization
D. Increased query complexity
Why might queries be slower in a Snowflake Schema compared to other schemas?
A. Because there are fewer tables to join
B. Because there are more joins required
C. Because data is denormalized
D. Because there are no relationships
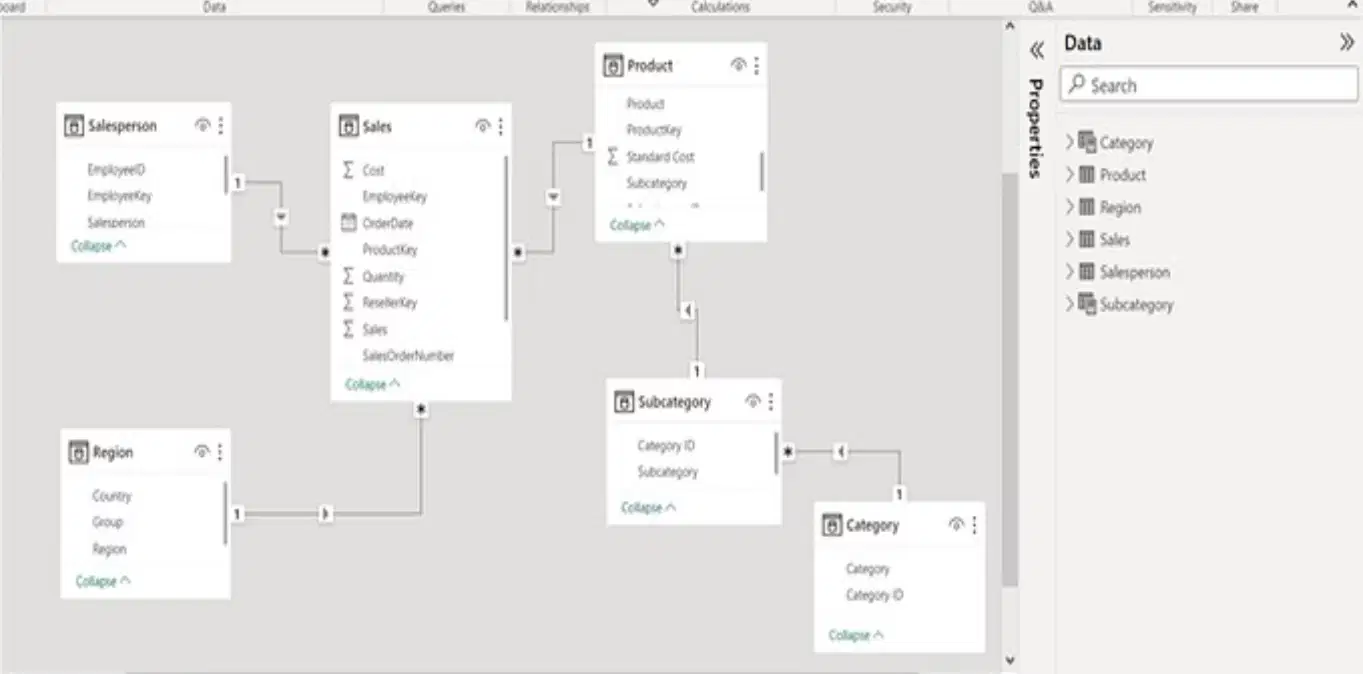
What is the primary purpose of creating relationships between tables in a data model, as shown in the image?
To store more data
To enable data analysis across multiple tables
To increase the speed of data entry
To create visualizations automatically
Suppose you want to add a new calculated column to analyze profit margin in the data model. Which feature in the Power BI Desktop ribbon would you use?
New table
New measure
New column
Manage relationships
Which type of table contains numeric, measurable data such as Sales, Revenue, and Quantity?
Fact Table
Dimension Table
Reference Table
Lookup Table
Fact tables are best described as:
Containing descriptive context with low volume
Containing numeric, measurable, high-volume transactional data
Storing only text-based information
Used only for storing dates
A company wants to analyze sales performance by product and date. Which tables would most likely be used for the descriptive context in this analysis?
Fact tables
Dimension tables
Transaction tables
Summary tables
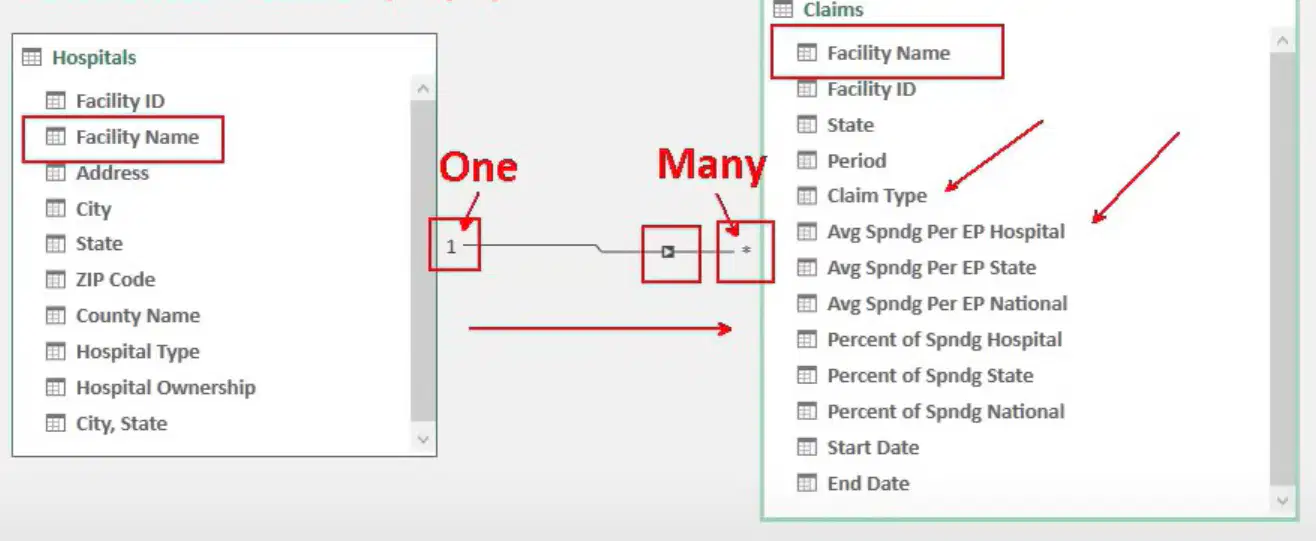
What is the primary purpose of a Dimension table in a database schema as illustrated in the diagram?
To store transactional data
To store descriptive attributes about entities
To calculate averages
To record claim types
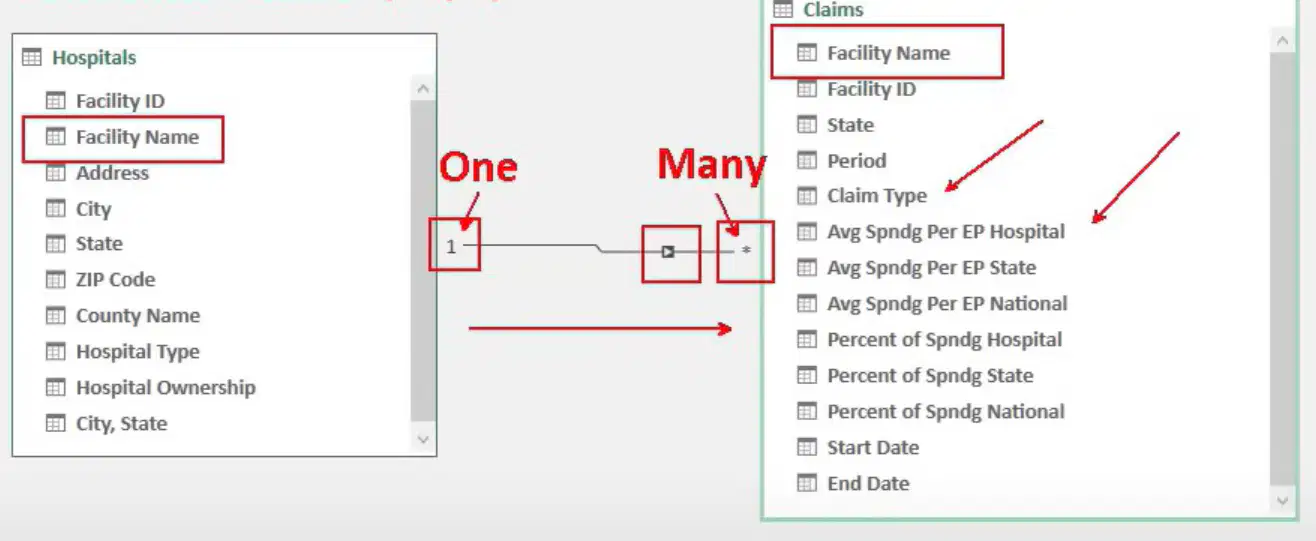
Based on the diagram, which of the following fields would most likely be used to analyze spending patterns across different hospitals?
Facility ID
Avg Spndg Per EP Hospital
County Name
Hospital Ownership
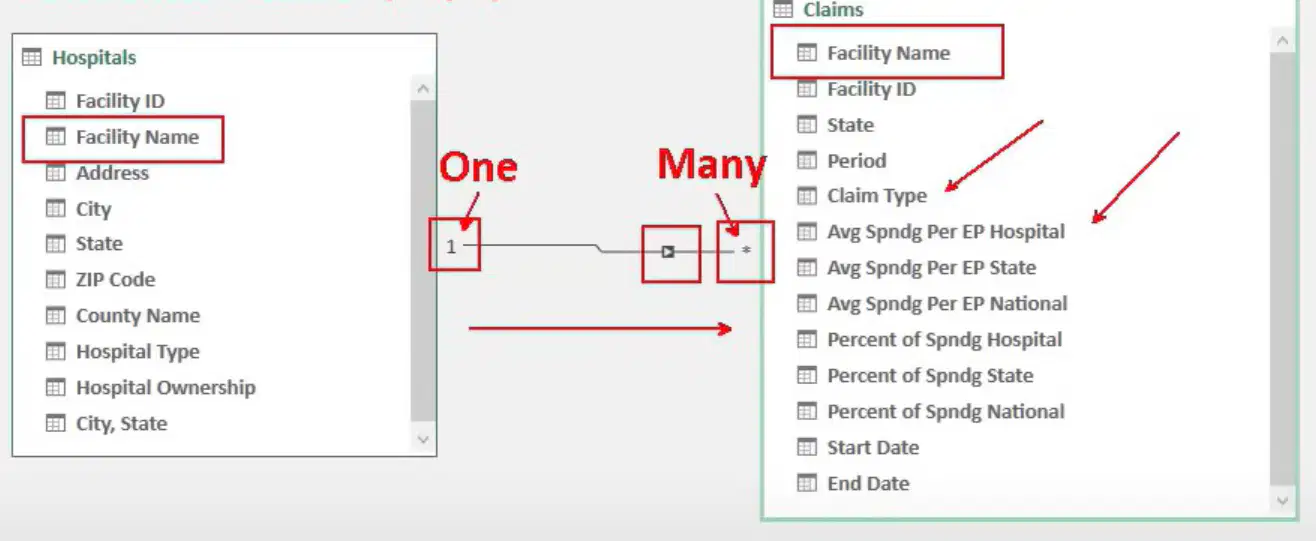
If you wanted to find the average spending per episode at the national level, which field from the Fact table would you use?
Avg Spndg Per EP Hospital
Avg Spndg Per EP State
Avg Spndg Per EP National
Percent of Spndg State
How does an optimized schema impact the performance of data visuals?
It makes visuals slower
It makes visuals faster
It increases memory usage
It causes incorrect results
A company is experiencing slow report generation and incorrect results from their data model. Based on the information provided, what is the most likely cause?
Poor schema design
Optimized schema
Scalable data model
Smaller memory footprint
Which schema is recommended to use where possible according to best practices for data modelling?
Star Schema
Snowflake Schema
Galaxy Schema
Network Schema
What is the recommended approach for fact tables in data modelling best practices?
Keep them lean
Add as many columns as possible
Use only text fields
Avoid using them
What is the suggested alternative to text joins in data modelling best practices?
Use surrogate keys
Use composite keys
Use natural keys
Use foreign keys only
A data modeler is designing a new data warehouse. They are considering whether to use text joins or surrogate keys for linking tables. Based on best practices, what should they choose and why?
Use surrogate keys because they are more efficient than text joins
Use text joins because they are easier to understand
Use composite keys because they are more secure
Use natural keys because they are always unique
Which of the following best describes the foundation of Power BI’s data model?
Charts
Tables
Reports
Dashboards
What type of table in Power BI stores quantitative, transactional data such as Sales, Revenue, and Quantity?
Dimension tables
Reference tables
Fact tables
Lookup tables
Which of the following is an example of a dimension table attribute in Power BI?
Revenue
Quantity
Date
Sales
How do relationships in Power BI contribute to meaningful analysis?
By connecting charts to dashboards
By connecting facts to dimensions
By connecting reports to data sources
By connecting tables to queries
What type of data do fact tables store?
Numerical/measurable data
Textual/descriptive data
Image data
Audio data
Which of the following is an example of data that might be stored in a fact table?
Customer names
Sales
Product descriptions
Employee addresses
Why are fact tables important in data analysis?
They store numerical data that can be measured and analyzed, such as sales, hours, and orders.
They store only text data for documentation.
They are used to store images and videos.
They are used to store website URLs.
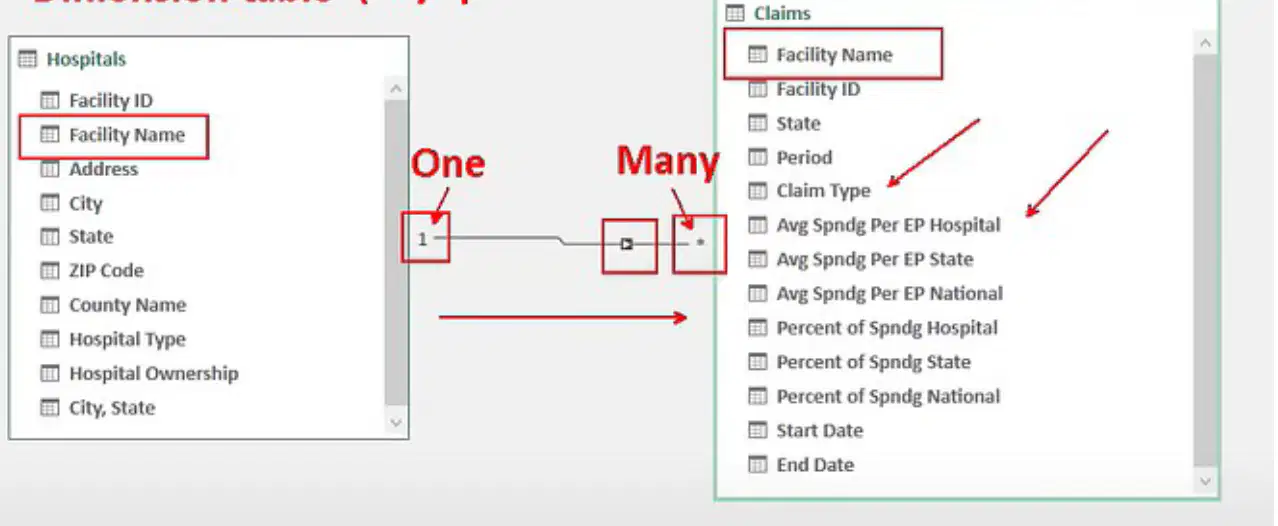
In a star schema, what is the primary purpose of the Dimension table as illustrated in the diagram?
To store transactional data
To provide descriptive attributes for analysis
To calculate averages
To record claim types
What is the result of combining a fact table with dimension tables?
Simple data storage
Powerful analysis
Data deletion
Data encryption
Which of the following is enabled by combining fact tables, dimension tables, and relationships?
Data loss
Insightful reports and dashboards
Data corruption
Data backup
Why is the one-to-many (1:*) relationship considered important in data modeling?
It is the most common relationship and is used to link dimension tables to fact tables.
It is used only for linking two fact tables.
It is rarely used in practice.
It only applies to self-referencing tables.
What does a One-to-One (1:1) relationship in a database imply?
Both columns are unique, and this type of relationship is rare.
One column is unique, the other is not.
Both columns can have duplicate values.
It is the most common type of relationship.
Why is a One-to-One (1:1) relationship considered rare in databases?
Because both columns must be unique.
Because it allows for many-to-many relationships.
Because it is used for large datasets.
Because it is the default relationship type.
What type of relationship requires careful DAX handling and is used in composite models?
Many-to-Many
One-to-One
One-to-Many
Self-Referencing
Why does a many-to-many relationship in data models require special attention?
Because it needs careful DAX handling
Because it is always faster
Because it is only used in simple models
Because it does not support composite models
What is the default and safe cross filter direction in data modeling?
Single
Both
None
Multiple
Which cross filter direction treats tables as a single table?
Both
Single
None
Multiple
If you want to ensure the safest and default behavior when setting cross filter direction, which option should you choose?
Single
Both
None
All
Why might you choose the "Both" cross filter direction in a data model?
To treat related tables as a single table
To prevent any filtering
To ensure only one-way filtering
To disable all relationships
Which of the following statements is true about active relationships in data modeling?
Multiple relationships can be active at the same time
Only one relationship can be active at a time
No relationships can be active at any time
All relationships are always inactive
How can inactive relationships be used in DAX?
By using the USERELATIONSHIP function
By deleting the relationship
By renaming the relationship
By making it the default relationship
Which of the following is identified as the fact in the example model?
Orders
Customer
Date
Region
Which of the following is NOT listed as a dimension in the example model?
Product
Customer
Date
Region
If you were to analyze sales data using the example model, which dimensions would you use to break down the orders?
Customer, Date, Region
Product, Supplier, Price
Employee, Department, Salary
Category, Quantity, Discount
Which type of relationship is recommended to use wherever possible according to best practices?
One-to-Many
Many-to-Many
One-to-One
Self-Referencing
Why is it important to keep relationships simple in database design?
It makes the system easier to understand and maintain
It increases the complexity of queries
It allows for more data redundancy
It requires more storage space
What is a relationship in the context of databases?
A logical link between two tables
A type of data entry error
A method for deleting tables
A way to format text in a table
Which sequence of steps is required for manual creation of relationships in Power BI?
Home → Manage Relationships → New
File → Open → Relationships
Insert → Table → New
View → Data → Relationships
Suppose you want to create a relationship between two tables in Power BI without using autodetect. Which two alternative methods can you use?
Manual creation and drag-and-drop
Copy-paste and export
Delete and refresh
Import and export

Which software is shown in the image?
Power BI Desktop
Microsoft Word
Microsoft Excel
Tableau
When manually creating a relationship, which of the following must you select?
Table A & column, Table B & column
Only Table A
Only Table B
Only the cardinality
What does setting the cardinality in a relationship setup define?
The number of tables in the database
The type of data stored in the columns
The nature of the relationship (e.g., 1:1, 1:*)
The color of the table headers
Suppose you want to filter data for a specific report in Power BI Desktop. Which filter section should you use?
Page level filters
Drillthrough filters
Report level filters
Values
Why is the drag-and-drop method in Model View considered quick and intuitive?
It is especially suitable for smaller models
It requires advanced programming skills
It only works with large databases
It needs manual relationship creation
What does "cardinality" refer to when editing relationships?
The number of tables in a database
The direction of data flow
The type of relationship (One-to-one, One-to-many, Many-to-many)
The size of the columns
Suppose you have a relationship set as inactive, but you need it to be used in a specific calculation. What should you do?
Change the cardinality
Make the relationship active
Change the table name
Set cross-filter direction to both
What is the cardinality set for the relationship in the "Edit relationship" window?
Many to one (*:1)
One to many (1:*)
One to one (1:1)
Many to many (*:*)
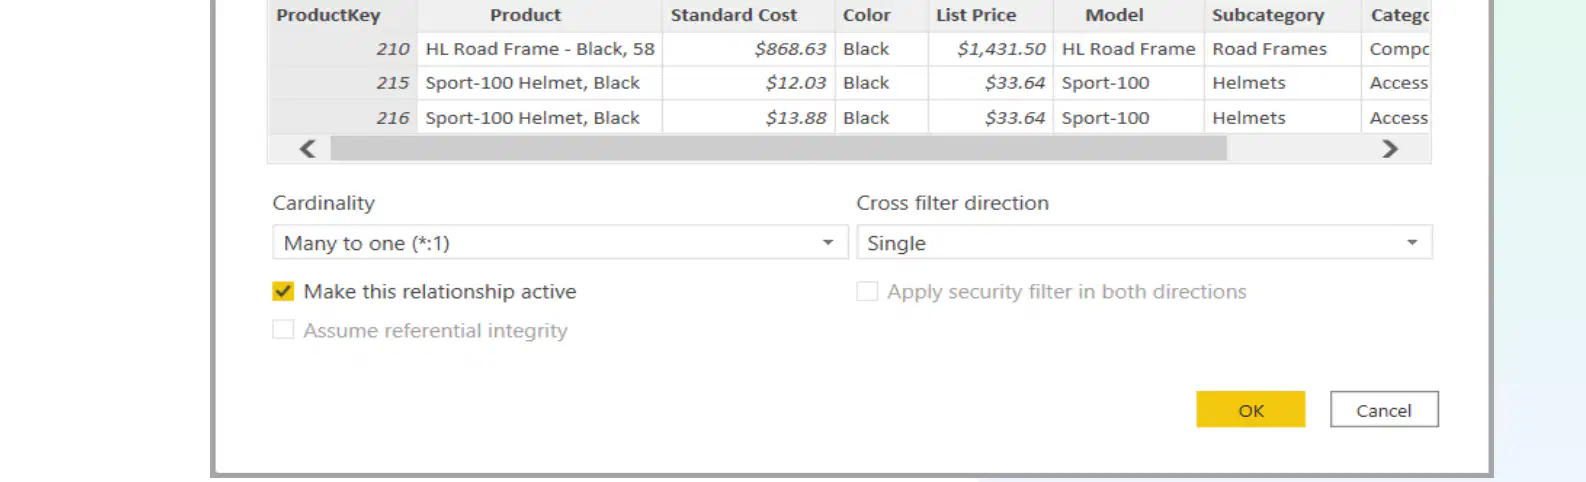
Which option is checked to ensure the relationship is active in the "Edit relationship" window?
Make this relationship active
Assume referential integrity
Apply security filter in both directions
Cross filter direction
If you wanted to filter data from the Product table to the Sales table, which cross filter direction would you select for a single direction filter?
Single
Both
None
Reverse
When does Power BI automatically detect relationships between tables?
When you load new tables with matching column names
When you delete tables from the model
When you export data to Excel
When you change the theme of the report
What happens when the source data structure changes in Power BI?
Power BI keeps relationships updated
Power BI deletes all relationships
Power BI ignores the changes
Power BI exports the data automatically
Which of the following is an example that can trigger relationship detection in Power BI?
Adding new fields or updating column names
Changing the report title
Printing the report
Logging out of Power BI
Why is it important to review auto-created relationships in Power BI?
They may be incorrect or not optimal
They always delete your data
They change the report layout
They increase the file size
What does the "Autodetect new relationships after data is loaded" option do in Power BI?
Automatically creates new relationships between tables after data is loaded
Deletes all existing relationships
Prevents any relationships from being created
Only updates relationships during data refresh
Enabling "Enable parallel loading of tables" in Power BI can improve performance in which scenario?
When loading multiple large tables simultaneously to reduce overall load time
When only one small table is being loaded
When you want to prevent any tables from loading
When you want to disable all background processes
Which type of cardinality relationship is typically used in advanced or composite models?
One-to-Many (1:*)
One-to-One (1:1)
Many-to-Many (:)
None of the above
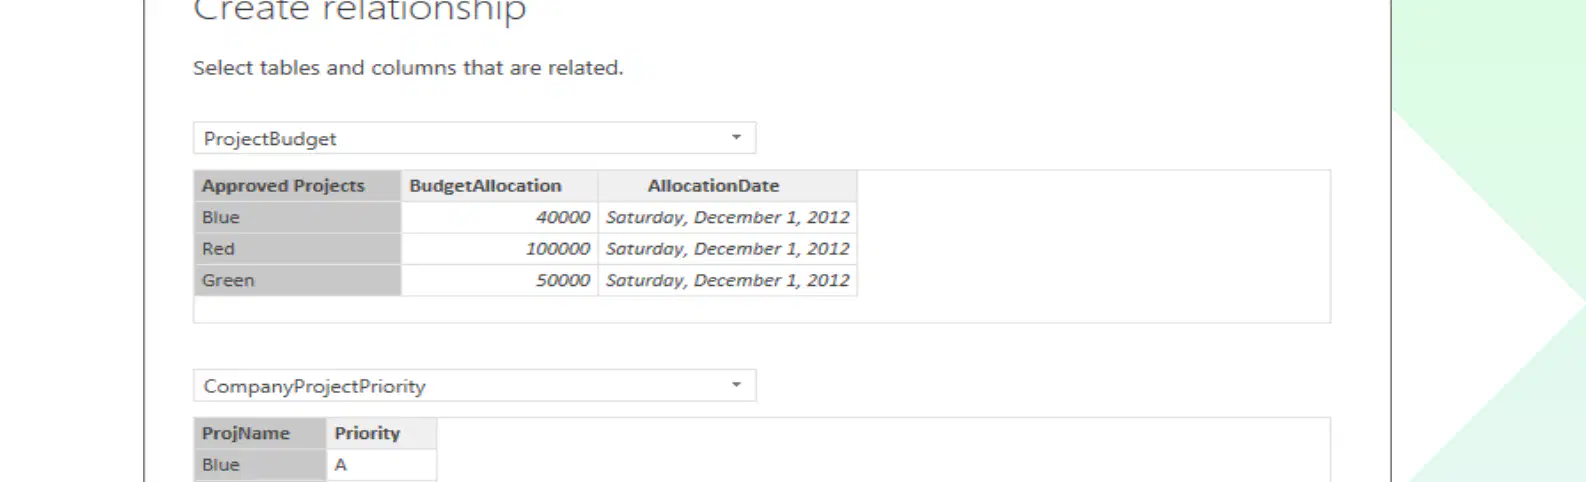
Given the data in the ProjectBudget and CompanyProjectPriority tables, which project would you recommend prioritizing if the company wants to focus on the project with the highest budget allocation and a priority of B or higher? Justify your answer.
Blue
Red
Green
None of the above
What can happen if a cross filter is set up incorrectly?
The filter will not work at all
It may cause ambiguous results
The filter will always flow both ways
The filter will be deleted
Why should you use caution when setting a cross filter to both directions?
It is the default setting
It can filter in both ways, which may lead to unexpected results
It disables filtering
It only works with certain data types
How many active relationships can exist per table pair?
Only one
Two
Unlimited
None
If you need to change which relationship is active between two tables, what should you do?
Use the Manage Relationships feature
Delete both tables
Rename the tables
Add a new column
What does the Relationship View (Model View) provide a visual view of?
Tables and relationships
Charts and graphs
Data and queries
Reports and dashboards
Suppose you are working with a data model that has many interconnected tables. How might the Relationship View (Model View) help you manage this model?
By providing a visual representation and allowing drag-and-drop editing of tables and relationships
By automatically generating all queries
By encrypting all data
By exporting the model to a PDF
What type of data do Power BI Date Tables contain?
Only date-related data
Only numeric data
Only text data
Only financial data
How do Power BI Date Tables support time intelligence calculations?
By enabling calculations based on dates
By storing images
By encrypting data
By managing user accounts
A company wants to analyze its sales data by year, quarter, month, and day. Which feature of Power BI Date Tables makes this possible?
Their ability to store product information
Their use for analyzing data by different time periods
Their support for financial transactions
Their ability to manage user roles
Which of the following is a primary reason for using date tables in data analysis?
To store large amounts of text data
To allow slicing & dicing data by date attributes
To improve network security
To reduce the size of the database
How do date tables support time-series analysis?
By providing random data points
By supporting accurate and continuous time-series analysis
By encrypting the data
By removing duplicate records
Which of the following is another name for Date Tables?
Calendar Tables
Time Series Tables
Event Tables
Data Fact Tables
If you encounter a "Calendar Dimension Table" in a database, what is it most likely referring to?
A type of Date Table
A table for storing product information
A table for user credentials
A table for sales transactions
What is the main characteristic of the Auto Date/Time method in Power BI?
It uses M-query to generate tables
It is hidden and auto-generated
It requires manual import
It uses CALENDAR() function
Which DAX functions can be used to create date tables in Power BI?
CALENDAR() and CALENDARAUTO()
DATEADD() and DATEDIFF()
NOW() and TODAY()
TIME() and HOUR()
Which method is best for creating a date table that updates automatically as new data is added?
Source Data, because it is always up-to-date
Auto Date/Time, because it is hidden and auto-generated
DAX, because it allows for custom date ranges
Power Query, because it can generate dynamic date tables using M-query
What should you do if your data source already contains a date table?
Recreate the date table from scratch
Ignore the date table and use only raw data
Just import the date table and build relationships
Delete the date table before importing
Why is it unnecessary to recreate a date table if one already exists in the source data?
Because it is faster to recreate it
Because you can simply build relationships with the existing table
Because the existing table is always incorrect
Because recreating is required for all sources
Which menu path should you follow to enable the Auto Date/Time feature?
File → Options → Data Load → Time Intelligence
File → Save As → Data Load → Time Intelligence
Edit → Preferences → Data Load → Time Intelligence
View → Options → Data Load → Time Intelligence
What does the Auto Date/Time method create for each date column?
Visible date tables
Hidden date tables
Manual date tables
Linked date tables
Which of the following is included in the Date Hierarchy provided by the Auto Date/Time method?
Year, Week, Hour, Minute
Year, Quarter, Month, Day
Year, Month, Week, Day
Year, Quarter, Week, Day
What is a limitation of the Auto Date/Time method?
It is slow and complex
It only works with multiple tables
It is limited to a single table
It does not provide a date hierarchy
Which of the following elements are included in the Date Hierarchy when you expand the date column?
Year, Quarter, Month, Day
Week, Month, Year, Hour
Customer ID, Order ID, Product Name, Price
Year, Week, Day, Hour
Which of the following columns can you add using DAX formulas as mentioned in the material?
Year, Month, Weekday, Quarter
Hour, Minute, Second, Millisecond
Product, Sales, Region, Country
Name, Address, Phone, Email
Which DAX function is used to extract the year from a date column in Power BI?
YEAR()
MONTH()
FORMAT()
DATE()
What is the purpose of the FORMAT function in the DAX formula: FORMAT('Date'[Date], "mmmm")?
To extract the year from a date
To extract the numeric month from a date
To format the date as the full month name
To create a new table
What is the value of the "MonthNum" column for all the dates shown in the table?
1
2
12
0
According to the table, which month is represented for all the dates listed?
January
February
March
December
Based on the table, what year do all the dates belong to?
2015
2016
2014
2020
How does the dynamic date table in Power Query respond to new data?
It updates automatically
It requires manual refresh
It deletes old data
It creates duplicate tables
After right-clicking in the empty space of the Queries pane, which of the following is NOT an option available in the drop-down menu?
New Query
New Parameter
Delete Query
New Group
What does #duration(1,0,0,0) mean in the context of the M-query?
1 hour, 0 days, 0 minutes, 0 seconds
1 day, 0 hours, 0 minutes, 0 seconds
1 minute, 0 hours, 0 days, 0 seconds
1 second, 0 days, 0 hours, 0 minutes
What is an advantage of using the M-query to create a date table as described?
The date table must be recreated manually
The date table auto-updates when new data comes in
The date table only works for one year
The date table cannot be updated
Which date corresponds to the 10th entry in the list?
10/01/2015
01/10/2015
20/01/2015
11/01/2015
What is the first step you must take before including other date-related columns when creating date tables using the DAX equation approach?
Change the date column's data type to Date
Add a new column for each date-related value
Delete all existing columns
Rename the column to "Date"
After successfully using Power Query as described, what have you created?
A chart
A date table
A pivot table
A data model
How do calculated columns appear in the Fields pane?
As hidden columns
Like regular columns with a special icon
As measures
As tables
If you want to add a custom column to a report visualization, what is the correct procedure based on the information provided?
Use only the default columns provided.
Rename the column as desired and add it to the report visualization.
Only use columns with numeric values.
Columns cannot be added to report visualizations.
Which of the following best describes when a Custom Column (Power Query) is created?
During data load, before data is in the model.
After data is in the model, works with model relationships.
After data is visualized in reports.
Only when exporting data to Excel.
What is a key difference between a Calculated Column (DAX) and a Custom Column (Power Query)?
Calculated Columns are created before data load, Custom Columns after.
Calculated Columns are created after data is in the model, Custom Columns before.
Both are created at the same time.
Custom Columns work with model relationships, Calculated Columns do not.
What is the purpose of creating a "City + State" column in the given business case?
To show City and State together
To separate City and State
To hide City and State
To delete City and State
Which DAX formula is used to combine City and State into a single field?
CityState = [City] & ", " & [State]
CityState = [City] + [State]
CityState = [State] - [City]
CityState = [City] * [State]
After creating the CityState field, where can it be added for visualization?
Maps
Charts
Tables only
Dashboards only
Why might a shipping manager want to create a new field combining City and State?
To display both location details together for better visualization
To reduce the number of columns in the table
To hide sensitive information
To increase data redundancy
What is the result of the DAX formula: CityState = [City] & ", " & [State]?
A new field combining City and State with a comma separator
A new field showing only City
A new field showing only State
A new field with City and State separated by a dash
Which columns are involved in creating the CityState field in the Geography table?
City and State
Product and State
Geography and Product
City and Product
Suppose you have a row where the City is "Dallas" and the State is "Texas". What would be the value in the CityState field after applying the described process?
Dallas Texas
Texas, Dallas
Dallas, Texas
Texas Dallas
What is the purpose of the CityState field mentioned in the material?
To add location-based data to visualizations
To calculate shipment costs
To filter out irrelevant data
To create text summaries
Which of the following best describes a feature of the CityState field?
It can only be used in bar charts
It can be added to just about any type of visualization
It is limited to text-based reports
It is used only for filtering data
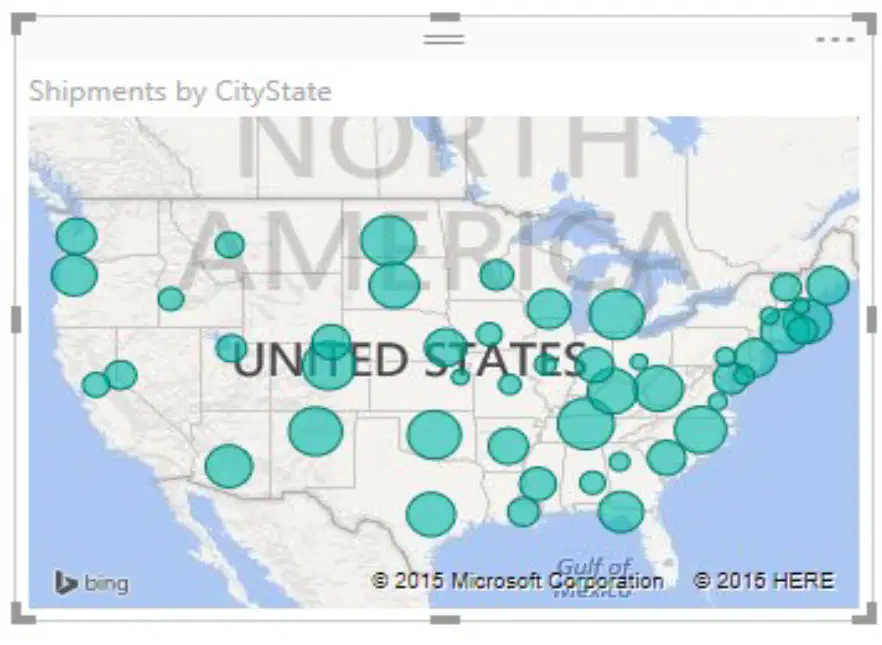
Suppose you want to visualize shipment data by location. How would the CityState field help you achieve this?
By allowing you to plot shipment data on a map
By summarizing shipment data in a table
By hiding shipment data from the visualization
By converting shipment data into text format
Which language is used to create an entirely new calculated table in data models?
SQL
DAX
Python
R
Which of the following is NOT a typical use case for calculated tables?
Filtering subsets of data
Creating role-playing dimensions
Aggregating data differently
Storing raw source data
A company wants to analyze sales data by different time periods using the same date information. Which feature of calculated tables would be most useful in this scenario?
Filtering subsets of data
Creating role-playing dimensions
Loading data from the source
Storing unprocessed data
What is the purpose of the calculated table shown in the example?
To create a table for 2024 Sales only
To delete sales data from 2024
To summarize all years' sales
To filter out all sales except 2023
Which DAX function is used in the example to filter sales data for the year 2024?
SUM
FILTER
AVERAGE
COUNT
What happens when you create a calculated table as shown in the example?
It replaces the original table
It adds a new table in the Fields list
It deletes all existing tables
It merges all tables into one
Which tool is used to work row-by-row when creating calculated columns?
SQL
DAX
Python
R
What is a key benefit of using calculated tables in data modeling?
They add new fields inside a table.
They generate entire new tables.
They visualize data.
They encrypt data.
How do calculated tables help in the data modeling process?
By improving data security
By restructuring data for modeling
By visualizing data
By cleaning data
Both calculated columns and calculated tables contribute to which aspect of data modeling?
Data encryption
Data modeling flexibility
Data storage
Data deletion
A data analyst wants to restructure data for better modeling. Which feature should they use?
Calculated columns
Calculated tables
Data encryption
Data visualization
Why might 'Measures in DAX for Data Modeling' be important for youth development programmes?
It helps in analyzing and interpreting data for better decision-making.
It is used for cooking recipes.
It is a type of physical exercise.
It is a method for painting.
Which of the following is NOT typically used as an aggregation or KPI in measures?
SUM
AVG
TEXT
COUNT
How do the results of measures behave when filters and slicers are applied?
They remain static
They adapt dynamically
They disappear
They become read-only
Which of the following fields is NOT listed under the "financials" table in the provided image?
Net Sales
Total Sales
Discount Band
Customer Name
If you wanted to analyze the overall revenue generated, which field would you most likely use from the list?
COGS
Total Sales
Discount Band
Segment
Which language is used to create calculated fields known as Measures?
SQL
DAX
Python
R
A user wants to calculate the maximum value in a dataset using a Measure. Which aggregation function should they use?
MIN
MAX
SUM
COUNT
Which of the following is a primary role of measures in data modeling?
Enhance fact tables with business calculations
Increase the number of columns in the data model
Store raw data only
Remove all calculated columns from reports
Why is it beneficial to keep the data model lightweight in data modeling?
To avoid storing calculated columns
To increase the complexity of the model
To duplicate data across tables
To slow down report generation
Which of the following is an example of time intelligence supported by measures in data modeling?
Year-over-Year (YoY) growth
Data encryption
Data normalization
Data backup
Which two fields are selected in the Fields pane for the visualization shown in the image?
Last Years Sales and Projected Sales
Sales and Profit
Gross Sales and Discounts
Country and Segment
What does the bar chart in the image compare?
Last Years Sales and Projected Sales
Sales and Profit
Discounts and Gross Sales
Country and Product
What is the main characteristic of the Auto Date/Time method for creating date tables in Power BI?
It uses M-query to generate tables
It is hidden and auto-generated
It requires manual import from a dataset
It uses CALENDAR() or CALENDARAUTO()
Which function(s) can be used in DAX to create a date table?
CALENDAR() or CALENDARAUTO()
M-query
Import Table
Auto Date/Time
What is the name given to the measure being created in the image?
Projected Sales
Last Years Sales
Channel Sales
Units Sold
Based on the formula shown in the image, which column is being summed to calculate "Last Years Sales"?
Sales[Projected Sales]
Sales[Units Sold]
Channel[Units Sold]
Sales[Channel]
How many DAX functions are available for measures?
Over 200
Over 50
Over 1000
Over 20
Which DAX function category would you use to calculate the year-to-date total?
Time intelligence
Text
Logical
Aggregation
Which of the following pairs correctly matches a DAX function with its category?
SWITCH - Logical
AVERAGE - Text
RIGHT - Aggregation
TOTALYTD - Logical
A business analyst wants to compare sales from the same period last year using DAX. Which function should they use?
SAMEPERIODLASTYEAR
LEFT
IF
SUM
Where do you select the field you want to move in Power BI Desktop?
Fields pane
Properties pane
Visualizations pane
Filters pane
After entering a folder name in the Display folder box, what happens to the field in Power BI Desktop?
The field is deleted
The field is hidden
The field moves into the newly created folder
The field is duplicated
Which of the following is NOT a field listed under the "Sales" table in the provided image?
Profit
DiscountAmount
SalesAmount
ProductKey
What is the purpose of the "Is hidden" toggle in the interface shown in the image?
To delete a field
To hide or show a field in reports
To rename a field
To export data
If you wanted to organize fields into a specific group for easier navigation, which feature in the interface would you use?
Description
Display folder
Is hidden
PromotionKey
Which statement best describes the impact of data modeling on dataset redundancy?
Data modeling increases redundancy in datasets
Data modeling has no effect on redundancy
Data modeling reduces redundancy in datasets
Data modeling ignores redundancy issues
Which of the following best describes the role of measures in DAX within Power BI?
They drive dynamic, reusable, and consistent calculations
They are used only for data import
They are for formatting reports
They store raw data
According to best practices, what should you do with measures in Power BI?
Organize, optimize, and centralize them
Hide them from all users
Use them only once
Delete them after use
What is a standard use of a Power BI Date Table?
Referencing dates as a dimension table
Storing customer names
Calculating sales tax
Managing user permissions
Suppose you want to compare sales performance across different quarters and years in Power BI. Which feature of the Date Table would you use, and why?
Use the Date Table to enable time intelligence calculations, allowing comparison by Year and Quarter
Use the Date Table to store customer addresses
Use the Date Table to encrypt sensitive data
Use the Date Table to manage user roles
What function do date tables enable in DAX?
DAX time intelligence functions
DAX security functions
DAX formatting functions
DAX visualization functions
How do date tables support time-series analysis?
By providing random data points
By supporting accurate and continuous time-series analysis
By removing all date attributes
By limiting data to a single year
A company wants to analyze sales trends over several years and needs to ensure their analysis is both accurate and continuous. Which feature of date tables best supports this requirement?
Storing customer addresses
Accurate and continuous time-series analysis
Encrypting sensitive data
Generating random numbers
What is the main reason for requiring unique values in a date table?
Avoids duplicate calculations
Reduces memory usage
Increases processing speed
Allows for multiple time zones
A date table must have no missing dates. What does this requirement ensure?
Ensures full timeline
Reduces data redundancy
Increases data privacy
Allows for random sampling
Which of the following is another name for Date Tables?
Calendar Tables
Time Series Tables
Event Tables
Transaction Tables
Which term is NOT commonly used as another name for Date Tables?
Date Dimension Tables
Calendar Dimension Tables
Product Tables
Calendar Tables
If you encounter a "Calendar Dimension Table" in a database, what is it most likely referring to?
A table that stores product information
A table that stores date-related information
A table that stores customer addresses
A table that stores sales transactions
What should you do if your data source already contains a date table?
Recreate the date table from scratch
Ignore the date table and use your own
Just import the date table and build relationships
Delete the date table before importing
Why is it unnecessary to recreate a date table if one already exists in the source data?
Because it is faster to recreate it
Because you can simply build relationships with the existing table
Because the existing table is always incorrect
Because recreating is required for compatibility
What is a limitation of the Auto Date/Time method?
It is slow and complex
It only works with multiple tables
It is quick, but limited to a single table
It does not provide a date hierarchy
Which of the following columns can you add using DAX after creating a calendar table?
Year, Month, Weekday, Quarter
Product, Price, Discount, Tax
Customer, Region, Salesperson, Profit
Color, Size, Weight, Material
Which DAX function is used to extract the year from a date column in Power BI?
YEAR()
MONTH()
FORMAT()
DATE()
Given the formula Month = FORMAT('Date'[Date], "mmmm"), what would be the output if the date is 2023-04-15?
April
4
2023
15
A user wants to create a new column in Power BI that displays the year, month name, and month number from a date field. Which combination of DAX functions should they use?
YEAR(), FORMAT(), MONTH()
DAY(), FORMAT(), YEAR()
MONTH(), DAY(), FORMAT()
FORMAT(), YEAR(), DAY()
If you were to extend the table to include February, what would you expect the "MonthNum" value to be for February?
2
1
12
2015
What is the purpose of using the expression #date(2020,1,1) + #duration(1,0,0,0) in Power Query?
To create a static date value
To generate a dynamic date table
To filter data by year
To sort data by month
When using Power Query to generate a date table, which columns are typically included?
Name, Address, Phone
Year, Month, Quarter, Day
Product, Price, Quantity
Week, Hour, Minute

Which button should you click on the ribbon to navigate to Power Query?
Refresh
Transform Data
Enter Data
Format Painter

After right-clicking in the empty space of the Queries pane, which of the following is NOT an option available in the drop-down menu?
Excel Workbook
SQL Server
PowerPoint Presentation
OData feed
Why is there no need to recreate the date table manually in the M-query approach described?
Because the date table auto-updates with new data.
Because the table is static and never changes.
Because the table is deleted after each use.
Because the table only contains one date.
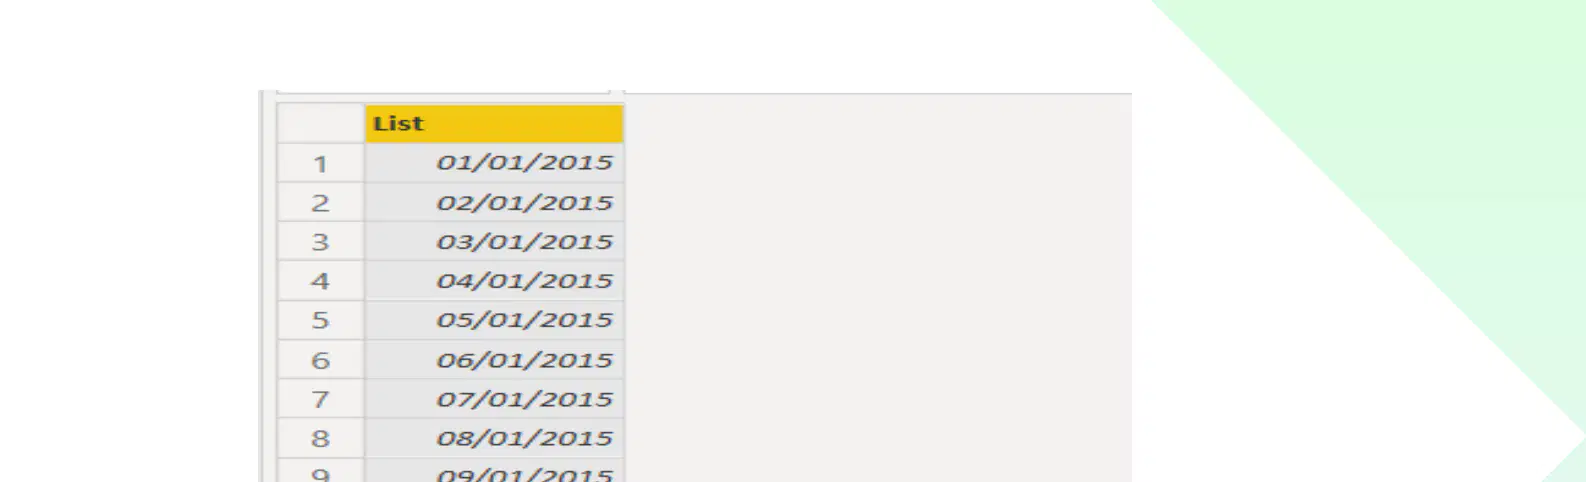
Which date corresponds to the 10th item in the list?
10/01/2015
01/01/2015
15/01/2015
20/01/2015
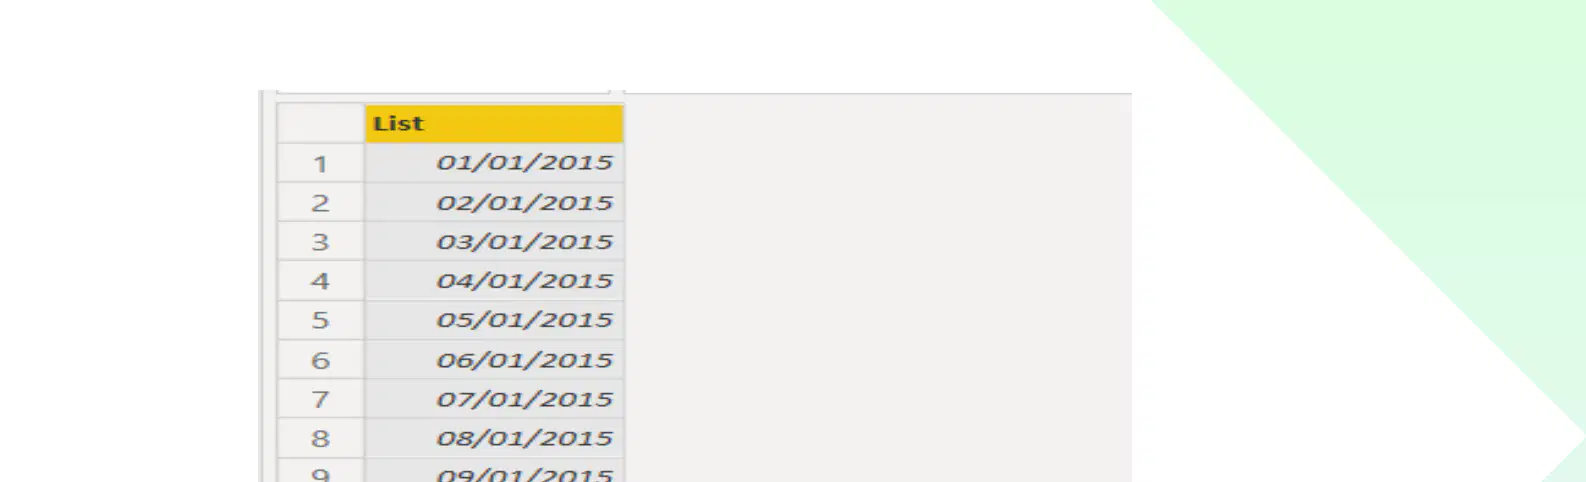
Based on the pattern in the table, what is the interval between each date in the list?
1 day
1 week
2 days
1 month
Which tab on the ribbon should you navigate to in order to change the result of the M-equation from a list of dates to a table of dates?
Home
View
Transform
Tools
What is the first step you must take before including other date-related columns when creating date tables using the DAX equation approach?
Change the date column's data type to Date
Add a new column for each date-related value
Rename the column to 'Date'
Delete all other columns except the date column
Why must a column in a Date Table have unique values?
To avoid duplicate records
To ensure it is recognized as Date datatype with unique values
To increase table size
To allow text entries
Which function requires a table to be marked as a Date Table?
Mathematical functions
String manipulation functions
Time intelligence functions
Sorting functions
Why is it important to optimize schema and relationships during model profiling?
To reduce the number of users
To improve model performance and efficiency
To increase dataset size
To add more storage modes
If a company wants to import data from both their ERP system and social media into the Import Model, what does this suggest about the flexibility of the Import Model?
The Import Model can only handle one data source at a time.
The Import Model is limited to on-premises data only.
The Import Model can integrate data from multiple and diverse sources.
The Import Model cannot import data from social media.
What is the purpose of enabling refresh failure notifications?
To be alerted when a data refresh fails
To increase the refresh speed
To reduce the number of refreshes
To disable incremental refresh
A business is experiencing slow report performance due to simultaneous Import and DirectQuery refreshes on the same gateway. What strategic change should they make?
Use separate gateways for Import & DirectQuery
Increase the refresh frequency
Disable incremental refresh
Ignore refresh failure notifications
Which of the following best describes the main purpose of query caching?
To store user passwords securely
To reuse cached results and boost performance
To increase the load on workspaces
To delete frequently accessed data
What is one benefit of query caching for workspaces?
It increases the amount of data stored
It reduces the load on workspaces
It slows down data access
It removes premium features
Which of the following should you do to prevent unnecessary hidden tables when loading data?
Enable Auto Date/Time
Avoid Auto Date/Time
Use GroupKind.Global
Confuse with "Hide in report view"
What happens when you create a calculated table as shown in the example?
A new table is added in the Fields list.
The original table is deleted.
All tables are merged into one.
A chart is automatically created.
How can the calculated table created for 2024 Sales be used?
Like any other table in relationships and visuals.
Only for viewing, not for analysis.
Only for exporting data.
Only for deleting records.
Suppose you want to analyze only the sales data for a specific year using the method shown. What would be your first step?
Use the FILTER function to select the desired year.
Delete all other years from the database.
Export the data to Excel.
Create a pie chart.
Why might using Auto Date/Time with many date/time fields in a model be problematic?
It generates multiple hidden tables, increasing memory usage.
It deletes existing tables.
It prevents data from being loaded.
It automatically shares data with other users.
How does the Auto Date/Time feature affect small models in Power BI Desktop?
It increases memory footprint and can slow down performance.
It reduces the size of the model.
It speeds up data processing.
It has no effect on performance.
Which of the following best describes the purpose of the "Time intelligence" setting shown in the image?
It automatically sets the date and time for new files.
It deletes old files automatically.
It changes the file format for new files.
It encrypts new files.
If you want to create a lean data model, what should you do with unwanted columns?
Remove them
Rename them
Duplicate them
Hide them
In the star schema diagram, what do the blue rectangles labeled "Dim" represent?
Fact tables
Dimension tables
Primary keys
Data cubes
Based on the diagram, what type of relationship exists between the "Fact" table and each "Dim" table in a star schema?
One-to-one
Many-to-many
One-to-many
Many-to-one
What is a key benefit of using bi-directional cross-filtering in data models?
It enables easier slicing and filtering across related tables.
It prevents any performance issues in complex models.
It eliminates the need for relationships between tables.
It guarantees consistent results in all scenarios.
A data analyst notices that their model is running slowly after enabling bi-directional cross-filtering. What is the most likely reason for this performance issue?
Overuse of bi-directional relationships has created long relationship propagation chains.
The tables are not related at all.
The model is too simple for bi-directional filtering.
Bi-directional filtering always increases performance.
Which two tables are being related in the "Edit relationship" window shown in the image?
Articles and Categories
Authors and Sections
Power BI Desktop and Power BI Service
Visualizations and Get started
What is the cardinality set for the relationship between the two tables in the image?
One to One (1:1)
Many to One (*:1)
One to Many (1:*)
Many to Many (*:*)
Why might you want to apply a security filter in both directions when setting up a relationship between tables?
To increase data redundancy
To ensure security rules are enforced across both related tables
To speed up data loading
To disable filtering between tables
Given the sample data, which category does the article dated 4/19/2016 belong to?
Power BI Desktop
Power BI Developer
Power BI Service
Power BI Mobile Apps
What is the recommended mode for dimension tables in a composite model?
Import mode
DirectQuery
Dual mode
Aggregation mode
According to best practices, how should the row count of an aggregation table compare to the fact table?
The same size as the fact table
2x smaller than the fact table
10x smaller than the fact table
100x larger than the fact table
A data modeler is working with a very large fact table and several dimension tables. Based on best practices, which configuration should they use for optimal performance?
Use Import mode for all tables
Use DirectQuery for fact tables and Dual mode for dimension tables
Use Dual mode for all tables
Use aggregation tables only
What should you avoid when dealing with large datasets?
Use Import for speed
Use Import for huge datasets
Use Star Schema
Use integers for keys
Which schema should be used for best practices in data modeling?
Star Schema
Snowflake Schema
Flat Table
Mixed Schema
What is a disadvantage of using strings for joins instead of integers?
It slows down query performance
It increases data security
It reduces data redundancy
It simplifies schema design
When comparing report performance, what should you observe to determine which schema is easier to maintain and more efficient?
A. The number of columns in each table.
B. The speed and ease of building visuals and maintaining the schema.
C. The color of the tables.
D. The number of users accessing the tables.
Suppose you have imported a Sales table and a Products table. Which schema would you use if you want to separate fact and dimension tables?
A. Flat schema
B. Star schema
C. Snowflake schema
D. Hierarchical schema
You are tasked with creating both a flat schema and a star schema for a dataset. What is a strategic reason for comparing their report performance?
A. To determine which schema is more visually appealing.
B. To identify which schema is easier to maintain and more efficient for reporting.
C. To see which schema has more tables.
D. To find out which schema uses more storage space.
Which tables need to be imported for the practice on table types and relationships?
FactSales, DimCustomer, and DimDate
FactSales, DimProduct, and DimDate
Sales, Customer, and Date
FactOrders, DimCustomer, and DimProduct
When testing cross-filtering in Power BI, what should you do to check if related sales update correctly?
Select a product and check inventory levels
Select a customer and check if related sales update
Select a date and check if all tables refresh
Select a region and check if customer names change
Suppose you delete a relationship in Power BI and use "AutoDetect" to rebuild it. What reasoning process are you using to ensure your data model is correct?
Guessing without evidence
Relying on default settings only
Testing and verifying connections by observing if related data updates as expected
Ignoring the results and moving on
What is the formula for calculating Profit as shown in the learning material?
Profit = FactSales[CostAmount] - FactSales[SalesAmount]
Profit = FactSales[SalesAmount] + FactSales[CostAmount]
Profit = FactSales[SalesAmount] - FactSales[CostAmount]
Profit = FactSales[CostAmount] / FactSales[SalesAmount]
Which tool is used to create a Date Table as mentioned in the practice section?
Microsoft Excel
Power BI
Tableau
Google Sheets
Which DAX function is used to calculate the total sales amount in the provided example?
SUM
AVERAGE
COUNT
MIN
What is the correct DAX formula to calculate the average sales per order?
AVERAGE(FactSales[SalesAmount])
SUM(FactSales[SalesAmount])
COUNT(FactSales[SalesAmount])
MAX(FactSales[SalesAmount])
Which measure would you use to calculate the year-to-date sales in DAX?
Sales YTD = TOTALYTD(SUM(FactSales[SalesAmount]), DimDate[Date])
Total Sales = SUM(FactSales[SalesAmount])
Average Sales per Order = AVERAGE(FactSales[SalesAmount])
Sales YTD = SUM(FactSales[SalesAmount])
If you are asked to add KPI cards for the measures created, what is the main purpose of a KPI card in a data model?
To visually display key performance indicators for quick insights
To store raw data
To perform data cleaning
To create relationships between tables
Given the measures Total Sales, Average Sales per Order, and Sales YTD, which of the following best describes the type of analysis you can perform with these measures?
You can analyze overall sales performance, average transaction value, and sales trends over time.
You can only count the number of sales transactions.
You can only display product names.
You can only filter data by customer.
Which of the following is a best practice for schema design and optimization?
Remove unnecessary columns
Add more surrogate keys to the report view
Avoid creating hierarchies in DimDate
Use as many columns as possible
What is the purpose of hiding surrogate keys from the report view in schema design?
To make the report view cleaner and easier to navigate
To increase the number of columns in the report
To display all technical details to end users
To slow down report performance
In the context of DimDate, which hierarchy is recommended to be created for better report navigation?
Year > Month > Day
Day > Month > Year
Month > Day > Year
Day > Year > Month
Which tool in Power BI is used to track slow visuals?
Data Profiler
Performance Analyzer
Query Editor
Visual Inspector
Why is it recommended to use measures instead of calculated columns in Power BI optimization?
Measures are easier to create
Measures can improve performance
Calculated columns are always faster
Measures are only for visuals
Which of the following is NOT listed as a dimension for the Sales Model in the capstone activity?
A) Date
B) Customer
C) Product
D) Revenue
Which of the following best describes the main purpose of creating a dashboard in the capstone activity?
A) To display only sales data
B) To visualize KPIs, trend charts, and slicers for analysis
C) To store customer information
D) To calculate profit margins only
Suppose you are managing a large fact table and want to optimize its performance. Which two strategies from the material should you implement?
Use incremental refresh and partition data by logical units
Delete old data and compress the table
Merge all data into one partition and disable refresh
Increase the number of columns and reduce indexing
Which of the following is a disadvantage of keeping unnecessary precision in your schema?
A. It simplifies the schema
B. It can increase storage and reduce performance
C. It helps in normalization
D. It enables better filtering
Why is it important to have efficient relationships in schema design?
To improve performance and scalability
To increase data redundancy
To make the schema more complex
To reduce the number of tables
Which of the following is a direct benefit of optimized models according to the material?
Faster reports
Slower processing
Increased errors
Lower accuracy
What is performance tuning primarily about, as mentioned in the material?
Efficient data model, smart refresh strategy, correct connection mode, and using best practices consistently
Adding more users to the system
Increasing the size of the database
Reducing the number of reports generated
Which of the following is NOT listed as a component of performance tuning in the material?
Efficient data model
Smart refresh strategy
Correct connection mode
Increasing hardware resources
Why is using best practices consistently important in performance tuning?
It ensures optimized models, leading to faster reports and better decisions.
It increases the complexity of the data model.
It reduces the need for a refresh strategy.
It eliminates the need for a connection mode.