
 Worksheets
Contents: Interview Questions List
Total questions: 30
Worksheet time: 45mins
Which task best reflects a data analyst’s responsibility?
Manage product marketing campaigns
Administer network security policies
Clean, analyze, and interpret datasets
Design machine learning architectures
Which skill is most essential for entry-level data analysts?
Advanced hardware troubleshooting
Strong SQL and spreadsheet skills
Professional video editing
Expertise in molecular biology
Which description best matches data cleansing?
Scaling servers horizontally
Encrypting tables and backups
Removing errors and inconsistencies
Building predictive neural networks
Which tool is widely used for data analysis?
Photoshop for retouching images
Illustrator for vector drawing
Excel with pivot tables and formulas
Premiere for video timelines
Which approach helps detect outliers?
Converting images to grayscale
Installing additional RAM modules
Using z-scores or IQR ranges
Encrypting the entire dataset
Which option describes KNN imputation?
Replacing nulls using nearest neighbors
Estimating means with bootstrapping
Dropping rows with any missing values
Encoding categories with frequency ranks
Which statement best characterizes a normal distribution?
Skewed right with heavy tail
Bimodal with two peaks
Uniform across all values
Symmetric bell around mean
Which phrase captures the idea of data visualization?
Encoding insights using charts
Encrypting data using keys
Sorting rows by timestamps
Compressing files for storage
What is a collision in a hash table?
Two keys mapping same bucket
Lossy compression of values
Failure in network routing
Multiple schemas in one table
Which scenario fits time series analysis?
Classifying images of animals
Forecasting monthly sales trends
Segmenting customers by hobbies
Balancing chemical equations
Which property is typical of clustering algorithms?
Render 3D objects from textures
Generate supervised class predictions
Encrypt databases using ciphers
Group similar items without labels
Which statement describes a pivot table’s usage?
Normalize features to unit variance
Encode categories using dummy variables
Summarize data by rows and columns
Plot geospatial heat maps automatically
Which term matches univariate analysis?
Two variables linked by causation
One variable examined at a time
Multiple variables jointly modeled
Three variables forming matrices
Which tool is popular in big data workflows?
Apache Spark for distributed processing
Inkscape for vector illustrations
Unity for real-time simulations
MATLAB Simulink for control
Which method defines hierarchical clustering?
Fit linear decision boundaries
Build tree of nested clusters
Score rules with Gini index
Reduce dimensions via PCA
Which description matches logistic regression?
Models probabilities for binary outcomes
Predicts continuous numeric values
Maximizes distances between clusters
Projects data onto principal components
Which phrase captures the K-means algorithm?
Sort records by primary key values
Partition data into k centroid clusters
Estimate class probabilities with logits
Encode sequences with n-grams counts
Which difference separates a data lake from a data warehouse?
Encrypted backups vs live transactions
Raw diverse storage vs structured curated
3D visual rendering vs tabular charts
Local desktop files vs cloud buckets
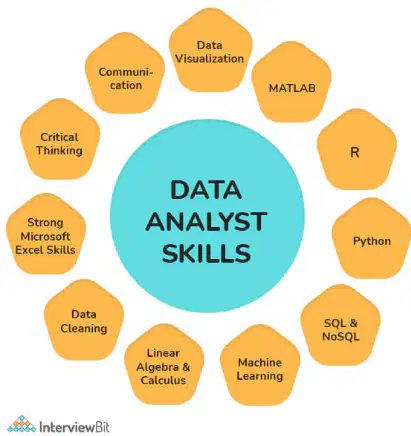
Which combination of skills best supports building reports and interpreting complex patterns?
Data visualization, SQL, and Python
Copywriting, HR policy, and mediation
Hardware soldering, cabling, and cooling
Event planning, branding, and photography
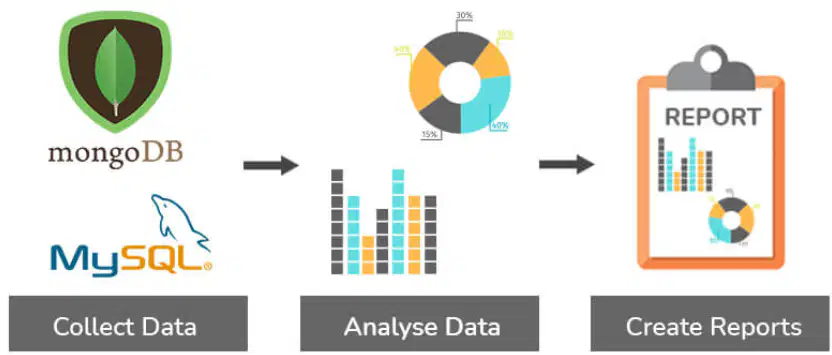
Which step in the data analysis lifecycle primarily focuses on removing missing values and outliers before any modeling begins?
Design databases and construct data models first
Create reports for stakeholders after implementation
Collect data from varied sources and prepare it
Analyse data with repeated modeling and validation
Which scenario most clearly requires data cleansing before analysis?
Well-documented data collected under standard protocols
Single-source data with complete validated records
Merged datasets with consistent schemas and formats
Multiple sources with inconsistent parameters and conventions
A team integrates data from two vendors and finds duplicate entries and spelling variations for the same customer. What is the best initial action to maintain data quality?
Delay analysis until new data arrives
Ignore duplicates to save processing time
Standardize entries and remove duplicates
Blend sources without cleaning steps
Which description best captures the core purpose of data cleansing?
Archiving old datasets for future audits
Identifying and modifying or deleting incorrect, incomplete, or irrelevant data
Increasing storage capacity for large-scale data lakes
Visualizing trends using dashboards and charts
Which option best describes the primary focus of data mining in analytics?
Summarizing attribute-level metadata for governance
Detecting unusual records and discovering hidden relations
Checking datasets for consistency and uniqueness
Collecting statistical summaries of existing raw data
Which scenario best exemplifies field level validation during data entry?
Search filters validated for relevant returned results
Records validated only when saving to database
Each field checked instantly as values are typed
Errors flagged after full form submission
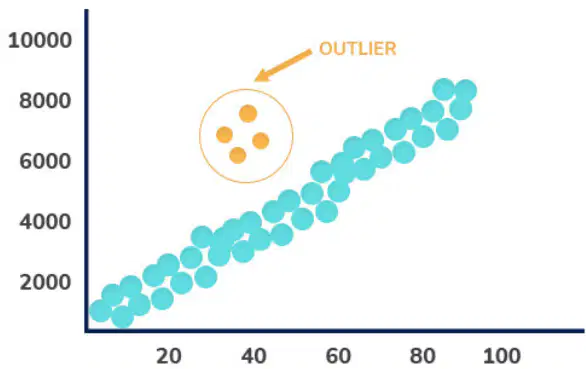
A box plot identifies outliers when a value lies beyond which threshold?
Mean ± one standard deviation
Median ± two standard deviations
Between Q2 and Q3 within 0.5×IQR
Above Q3 or below Q1 beyond 1.5×IQR
What is the core idea of KNN imputation for handling missing values?
Estimate missing values with a pre-trained classifier
Replace missing values with global mean of the column
Remove rows with any missing entries in features
Fill a missing value using the closest K similar records
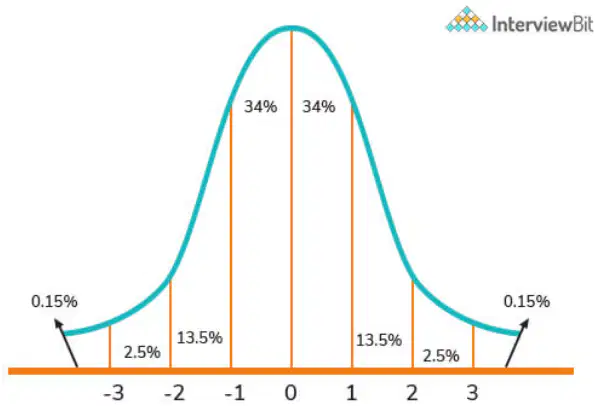
In a normal distribution curve shown, approximately what percentage of data falls within one standard deviation from the mean on each side?
About thirteen point five percent per side
About zero point fifteen percent per side
About twenty-five percent per side
About thirty-four percent per side
Which statement best describes the primary purpose of data visualization?
Ensure unique indices for keys
Reveal trends and outliers clearly
Store values in array slots
Match points using distance
You are given weekly sales data for two years. Which approach is most appropriate to capture seasonality and autocorrelation?
Pivot table grouping without temporal order
Collaborative filtering based on user interests
Time series analysis with lagged features
K-means clustering with Euclidean distance

