
 Worksheets
LINE GRAPH
Total questions: 16
Worksheet time: 13mins

Câu nào sẽ phù hợp NHẤT cho phần mở bài - introduction của đề sau:
"The line graph shows the percentage of New Zealand population from 1950 to 2050. Summarise the information by selecting and reporting the main features and make comparisons where relevant."
The given line chart depicts the propotion of the New Zealand population divided into 4 age groups starting in 1950, and including projections to the year 2050.
The given bar graph shows the breakdown of the percentage of New Zealand populated divided into 4 age groups starting in 1950, and including projections to the year 2050.
The line graph depicts the propotion of the New Zealand population starting in 1950.
The given line graph shows the breakdown of the New Zealand population divided into 4 age groups and including projections to the year 2050.
Bạn sẽ chọn ý nào vào phần tổng quan - overview?
Số lượng người ở độ tuổi 0-14 và độ tuổi 38-45 tăng mạnh trong 100 năm
Số lượng người ở độ tuổi 25-37 và độ tuổi trên 65 giảm nhẹ trong 100 năm
Số lượng người ở độ tuổi 38-45 tăng đột biến trong khoảng năm 1960 - 1990
Số lượng người ở độ tuổi 25-37 giảm đột biến trong khoảng năm 1960 - 2050
Trong số các từ vựng sau, từ vựng nào KHÔNG nên sử dụng để mô tả xu hướng - trend của biểu đồ đường?
declined
rocketed
account for
stable
S + v + adv + number + time period
1980: 4 million; 1990: 3.4 million
The number of commuters travelling by bus rose slightly, from 3.4 million to 4 million, between 1980 and 1990.
The number of commuters travelling by bus declined rapidly, from 4 million to 3.4 million, between 1980 and 1990.
The number of commuters travelling by bus dropped slightly, from 4 million to 3.4 million, between 1980 and 1990.
The number of commuters travelling by bus reduced moderately. from 4 million to 3.4 million, between 1980 and 1990.
There be + a/an + adj + noun + number + in + s + time period
1980: 4 million ; 1990: 3.4 million
There was a slightly decline of 0.6 million in the number of commuter travelling by bus, from 4 million to 3.4 million, between 1980 and 1990.
There was a slight decline of 0.6 million in the number of commuter travelling by bus, from 4 million to 3.4 million, between 1980 and 1990.
There was a gradual reduce of 0.6 million in the number of commuter travelling by bus, from 3.4 million to 34 million, between 1980 and 1990.
S + saw + a/an +noun + number + time period
( The number of people who commute by car: 1980: 5 million, 2000: 7 million)
The number of people who commute by car saw a slight increase, from 5 million to 7 million, between 1980 and 2000.
The number of people who commute by car saw a dramatic increase, from 5 million to 7 million, between 1980 and 2000.
The number of people who commute by car saw a moderate increase, from 5 million to 7 million, between 1980 and 2000.
The number of people who commute by car saw a significant increase, from 5 million to 7 million, between 1980 and 2000.
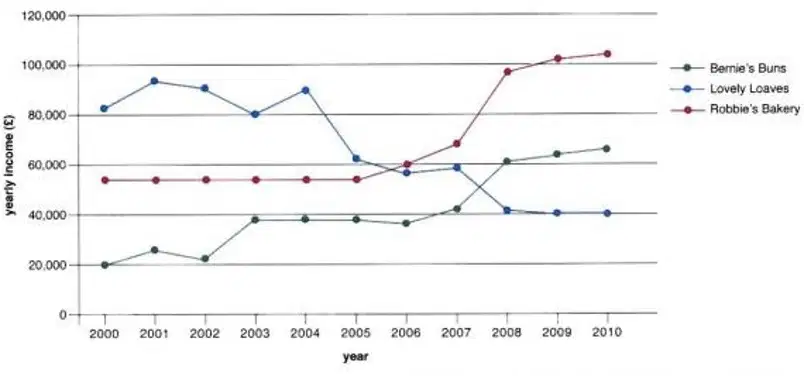
The graph shows data about the (1)of (2) bakeries in London, 2000-2010. (3)the information by selecting, reporting the main features, and make (4)where relevant.
(1) Summarize
(2) comparisons
(3) income
(4) three
(1) three
(2) Summarize
(3) comparisons
(4) income
(1) income
(2) three
(3) Summarize
(4) comparisons
(1) income
(2) comparisons
(3) three
(4) Summarize
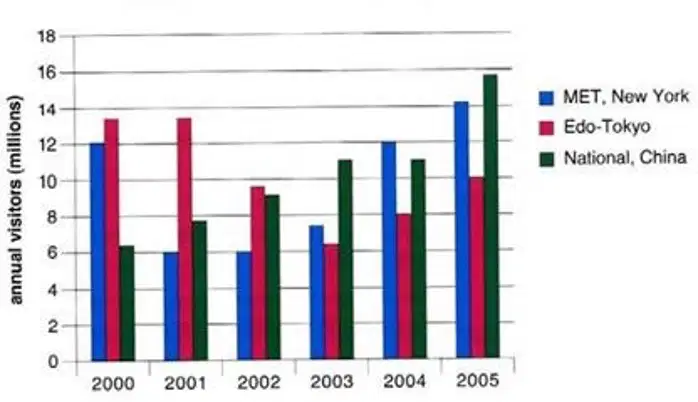
The graph below shows the number of (1) to (2) museums between 2000 and 2005.
Summarize the (3)by selecting and (4)the main features, and make comparisons where relevant.
(1) visitors
(2) three
(3) Information
(4) reporting
(1) Information
(2) reporting
(3) visitors
(4) three
(1) visitors
(2) reporting
(3) three
(4) Information
(1) reporting
(2) visitors
(3) three
(4) Information

The clothing Export of Myanmar rose (1) 800 million of dollars in 2000 (2) 900 million of dollars in 2001. As a result, the clothing Export of Myanmar rose (3) 100 million of dollars in one year.
(1) to
(2) from
(3) by
(1) from
(2) to
(3) by
(1) to
(2) by
(3) from

There was a rise (1) 100 million dollars (1) clothing Export of Myanmar (1) 2000 (1) 2001.
(1) from
(2) to
(3) of
(4) in
(1) in
(2) from
(3) of
(4) to
(1) from
(2) of
(3) in
(4) to
(1) of
(2) in
(3) from
(4) to

The sales peaked (1) 62.5 thousand of dollars hit the lowest point (2) 11thousand of dollars.
(1) at
(2) at
(1) in
(2) at
(1) at
(2) in

The number of 2008 fluctuated (1) 250 (2) 300 thousand of dollars. As a result, this number fluctuated (3) 50 thousand of dollars in 2008.
(1) to
(2) from
(3) around
(1) from
(2) to
(3) around
(1) around
(2) from
(3) to
There had been a steady rise in DVD sales for the first six months of the year.
DVD sales have increased firmly for the first six months of the year.
DVD sales had risen steadily for the first six months of the year.
There has been a steady increase in DVD sales for the first six months of the year.
The number of people attending the theatre has fallen dramatically.
There are fewer and fewer people attending the theatre.
The number of people attending the theatre has decreased slightly.
There has been a dramatic fall in the number of people attending the theatre.
There has been a rapid growth in the use of alternative energy sources.
The use of alternative energy sources has grown rapidly.
There has been a firm increase in the use of alternative energy sources.
The use of alternative energy sources has increased steadily.

Describe the trend of the graph.
Overall, there was an upward trend in the number of people......
Overall, there was a downward trend in the number of people......
Overall, there was a fluctuation trend in the number of people......
Overall, the number of people... fluctuated over the 4 years period.

