
 Worksheets
CEE8813 TSA Lecture 4
Total questions: 4
Worksheet time: 3mins
A new shopping mall increases traffic on adjacent roads, resulting in higher congestion. Which type of relationship among the three basic variables does this represent?
Type I
Type II
Type III
In an urban transportation network, sustained peak-hour demand led to the transit operator significantly increasing bus service frequency. What kind of relationship among the three basic variables does this scenario represent?
Type I
Type II
Type III
Due to the emergence of e-commerce companies such as Amazon, malls are starting to disappear. In the context of transportation systems analysis, such phenomena are reflected through:
Type I relationship
Type II relationship
Type III relationship
None of the above
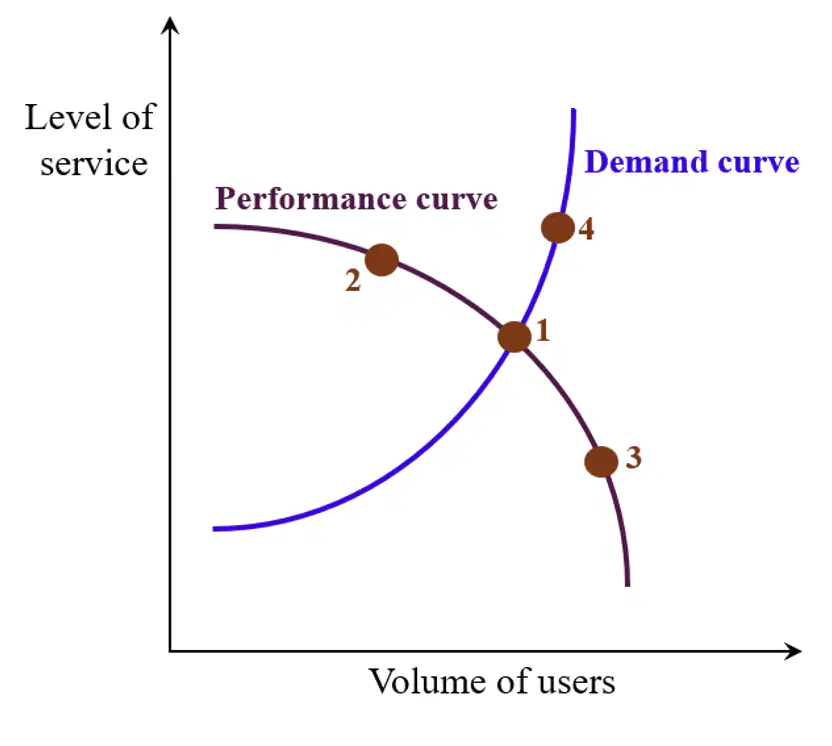
The current demand and performance curves for a city’s bus transit system are shown in the figure. If the city introduces real-time bus tracking to reduce uncertainty for passengers, what is the most likely location of the new equilibrium point?
1
2
3
4

