
 Worksheets
Unit 9 Sampling Distributions for Means Review
Total questions: 10
Worksheet time: 30mins
A manufacturer of cell phone batteries claims that the average number of recharge cycles for its batteries is 400. A consumer group will obtain a random sample of 100 of the manufacturer’s batteries and will calculate the mean number of recharge cycles. Which of the following statements is justified by the central limit theorem?
The distribution of the number of recharge cycles for the sample is approximately normal because the population mean of 400 is greater than 30.
The distribution of the number of recharge cycles for the sample is approximately normal because the sample size of 100 is greater than 30.
The distribution of the number of recharge cycles for the population is approximately normal because the sample size of 100 is greater than 30.
The distribution of the sample means of the number of recharge cycles is approximately normal because the sample size of 100 is greater than 30.
The distribution of the sample means of the number of recharge cycles is approximately normal because the population mean of 400 is greater than 30.
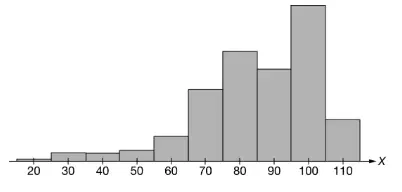
The graph shows the population distribution of random variable X with mean 85 and standard deviation 18. Which of the following graphs is a sampling distribution of the sample mean x̄ for samples of size 40 taken from the population?


Based on records kept at a gas station, the distribution of gallons of gas purchased by customers is skewed to the right with mean 10 gallons and standard deviation 4 gallons. A random sample of 64 customer receipts was selected, and the sample mean number of gallons was recorded. Suppose the process of selecting a random sample of 64 receipts and recording the sample mean number of gallons was repeated for a total of 100 samples. Which of the following is the best description of a dotplot created from the 100 sample means?
The dotplot is skewed to the right with mean 10 gallons and standard deviation 4 gallons.
The dotplot is skewed to the right with mean 10 gallons and standard deviation 0.5 gallon.
The dotplot is skewed to the right with mean 10 gallons and standard deviation 0.4 gallon.
The dotplot is approximately normal with mean 10 gallons and standard deviation 0.5 gallon.
The dotplot is approximately normal with mean 10 gallons and standard deviation 0.4 gallon.
At a certain high school, the distribution of backpack weight is approximately normal with mean 19.7 pounds and standard deviation 3.1 pounds. A random sample of 5 backpacks will be selected, and the weight, in pounds, of each backpack will be recorded. For samples of size 5, which of the following is the best interpretation of P(x̄ ≥ 22) ≈ 0.05?
The probability that each of the 5 backpacks selected will have a weight above 22 pounds is approximately 0.05.
The probability that each of the 5 backpacks selected will have a weight above 19.7 pounds is approximately 0.05.
The probability that the population mean is greater than 22 pounds is approximately 0.05.
For all samples of size 5, approximately 5% of the sample will have a probability greater than 22 pounds.
For all samples of size 5, the probability that the sample mean will be greater than 22 pounds is approximately 0.05.
There were 5,317 previously owned homes sold in a western city in the year 2000. The distribution of the sales prices of these homes was strongly right-skewed, with a mean of $206,274 and a standard deviation of $37,881. If all possible simple random samples of size 100 are drawn from this population and the mean is computed for each of these samples, which of the following describes the sampling distribution of the sample mean?
Approximately normal with mean $206,274 and standard deviation $3,788
Approximately normal with mean $206,274 and standard deviation $37,881
Approximately normal with mean $206,274 and standard deviation $520
Strongly right-skewed with mean $206,274 and standard deviation $3,788
Strongly right-skewed with mean $206,274 and standard deviation $37,881
The distribution of the length of employment for workers at a factory is moderately skewed to the right, with mean 7.4 years and standard deviation 5.6 years. The factory manager will select a random sample of 100 employees to survey. Which of the following best describes the sampling distribution of the sample means of length of employment for samples of size 100?
Moderately skewed to the right, with mean 7.4 years and standard deviation 5.6 years
Moderately skewed to the right, with mean 7.4 years and standard deviation less than 5.6 years
Moderately skewed to the right, with mean less than 7.4 years and standard deviation less than 5.6 years
Approximately normal, with mean less than 7.4 years and standard deviation 5.6 years
Approximately normal, with mean 7.4 years and standard deviation less than 5.6 years
At a large corporation, the distribution of years of employment for the employees has mean 20.6 years and standard deviation 5.3 years. A random sample of 100 employees was selected and surveyed about employee satisfaction. The sample of employees had a mean 20.3 years and standard deviation 6.1 years. Remy claims that the mean of the sampling distribution of the sample mean for samples of size 100 is 20.6 years. Is Remy’s claim correct?
No. The mean of the sampling distribution is 20.3 years.
No. The mean of the sampling distribution is 20.3 employees.
No. The mean of the sampling distribution is 5.3 years.
No. The mean of the sampling distribution is 20.6 employees.
Yes. The mean of the sampling distribution is 20.6 years.
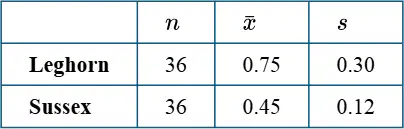
For a population of leghorn chickens, the mean number of eggs laid per chicken is 0.70 with standard deviation 0.20 egg. For a population of Sussex chickens, the mean number of eggs laid per chicken is 0.50 with standard deviation 0.10 egg. Two independent random samples of chickens were taken from the populations. The following table shows the sample statistics. Mike claims that for all samples of size 36 from the population of leghorn chickens and all samples of size 36 from the population of Sussex chickens, the mean of all possible differences in sample means (leghorn minus Sussex) is 0.30 egg per chicken. Is Mike’s claim correct?
Yes. The mean is 0.75 − 0.45 = 0.30 egg per chicken.
No. The mean is 0.30 − 0.12 = 0.18 egg per chicken.
No. The mean is 0.70 − 0.50 = 0.20 egg per chicken.
No. The mean is 0.20 − 0.10 = 0.10 egg per chicken.
No. The mean is 36(0.75) − 36(0.45) = 10.8 eggs per chicken.
At a large university, the division of computing services surveyed a random sample of 45 biology majors and 55 business majors from populations of over 1,000 biology and 1,000 business majors. The sampled students were asked how many hours they spend per week using any university computer lab. Let x̄1 represent the average hours per week spent in any university computer lab by the 45 biology majors, and let x̄2 represent the average hours per week spent in any university computer lab by the 55 business majors. Which of the following is the best explanation for why the sampling distribution of x̄1 − x̄2 can be modeled with a normal distribution?
The two sample standard deviations are assumed to be equal.
The sample sizes are both sufficiently large.
The distributions of the population are normal.
The population standard deviations are assumed equal.
There are at least 30 students in each of the two populations.
Cheryl practices hitting a softball in an indoor stadium by using both an aluminum bat and a composite bat made of carbon fiber and graphite. She records the distance traveled by the ball for each hit. Let x̄1 represent the average distance traveled by balls hit with the aluminum bat, and let x̄2 represent the average distance traveled by balls hit with the composite bat. Assume Cheryl’s batting practice hits are independent. Which of the following conditions are sufficient to model the sampling distribution of x̄1 − x̄2 with a normal distribution? I. There are at least 30 recorded distances traveled for each type of bat. II. The distribution of distance traveled by the ball is approximately normal for each bat. III. The total number of distances traveled is at least 60 for the two bats combined.
I only
II only
III only
I and II only
II and III only

