
 Worksheets
Post Test — Production Logging Tool (PLT) Interpretation
Total questions: 11
Worksheet time: 21mins
What is the basic PLT requirements?
The well should be stable
The well should be flowing on its normal producing choke.
Basic fluid properties
All of above.
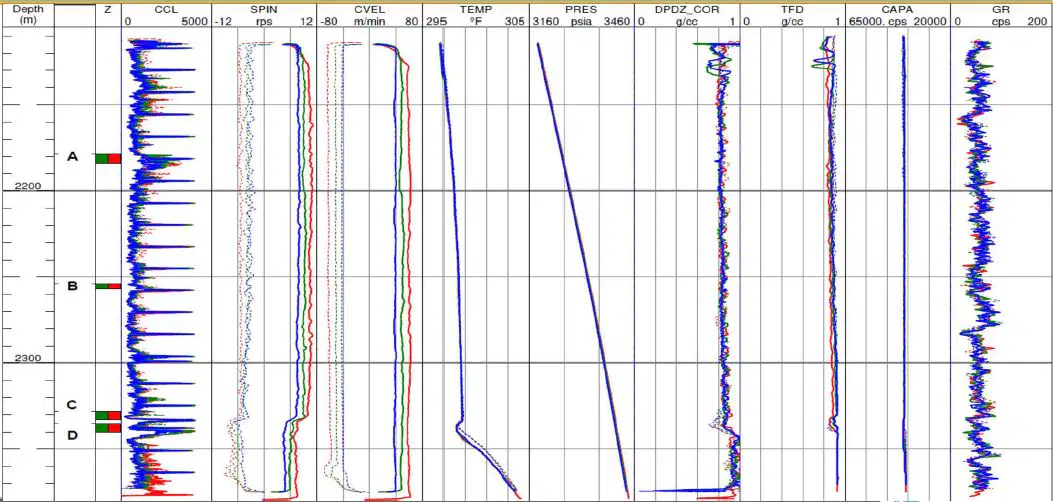
Where does water come from?
Zone A
Zone B
Zone C
Zone D
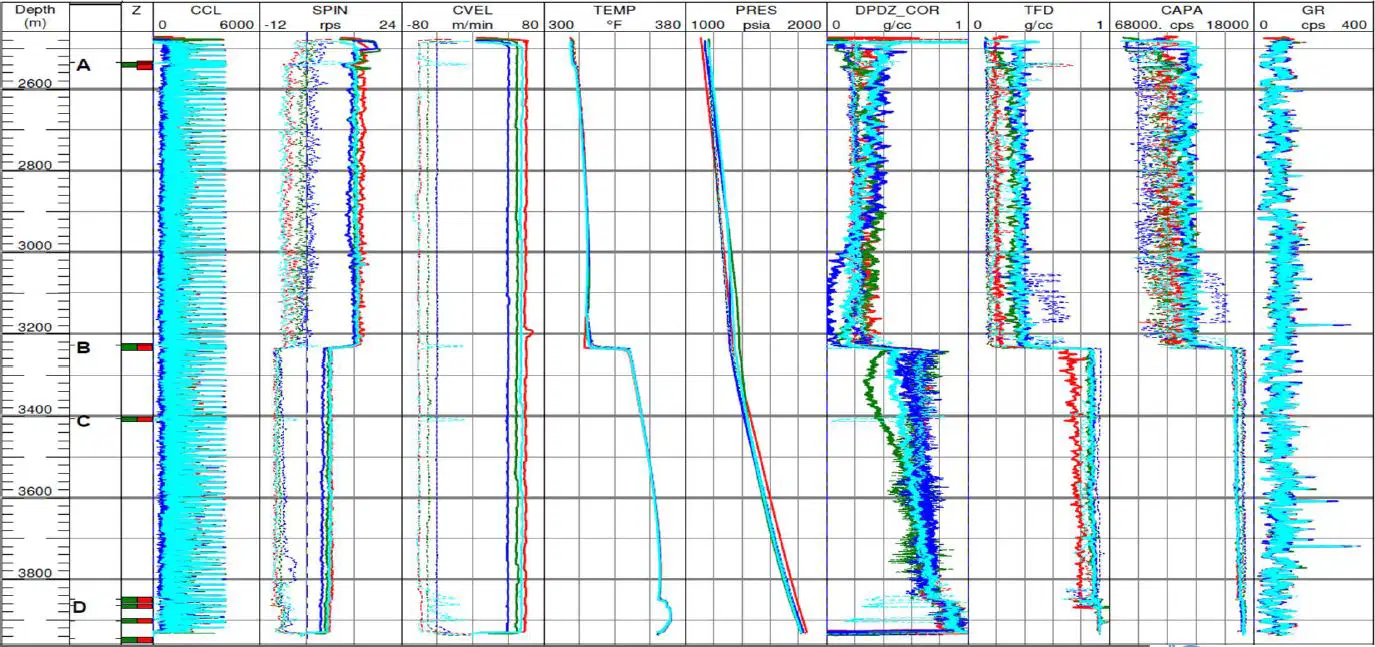
Where does the largest amount of gas inflow come from?
Zone A
Zone B
Zone C
Zone D
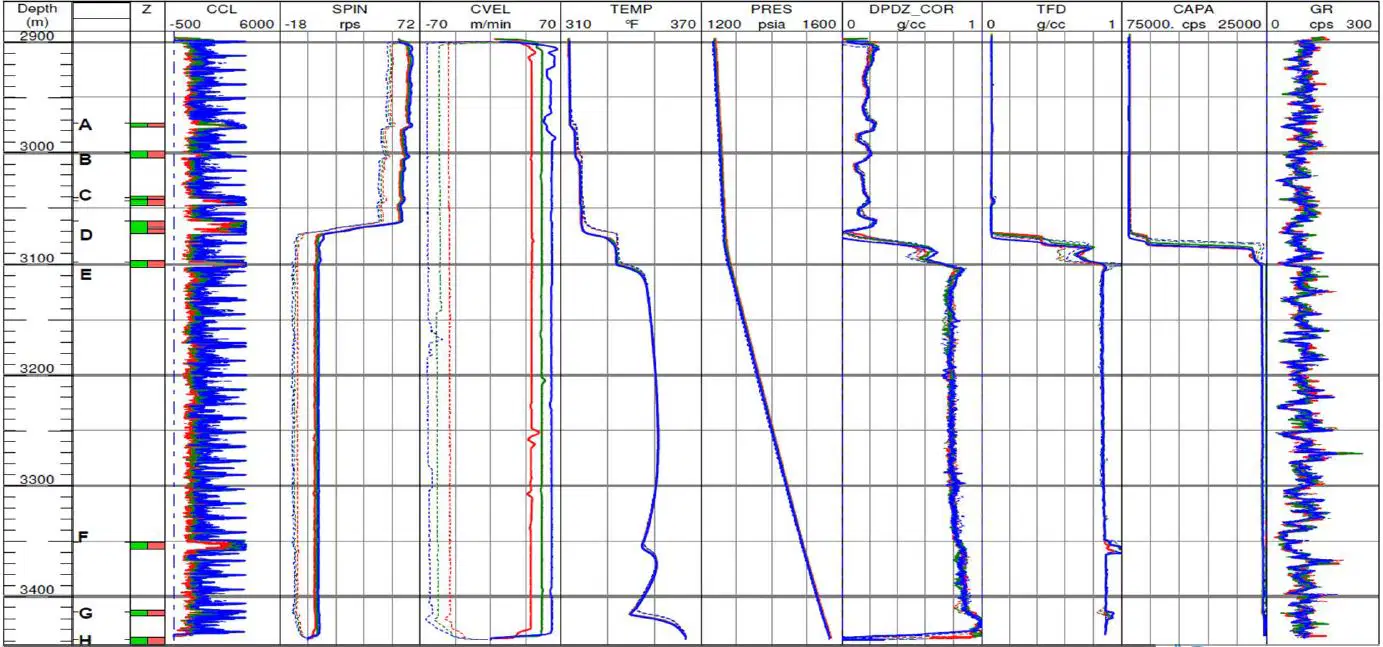
Which zones show apparent downflow?
Zone A and B
Zone C and D
Zone E and F
Zone F and G
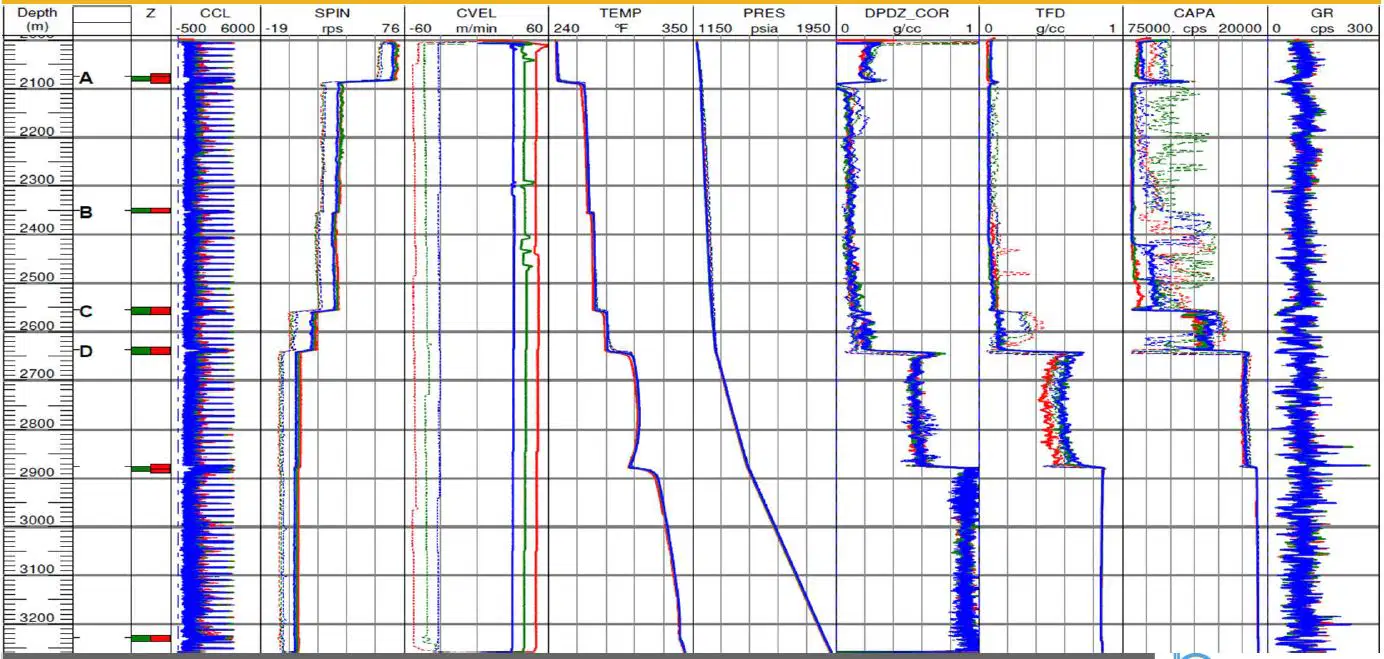
Which sand is the main source of water?
Sand A
Sand B
Sand C
Sand D

Describe direction of the crossflow ?
Upflow (from deeper B up into A)
Downflow (from shallower A down into B)
No measurable crossflow
Downflow (from B down into C)

3‑phase: Where is the main source of oil?
Sand A
Sand B
Sand C
Sand D
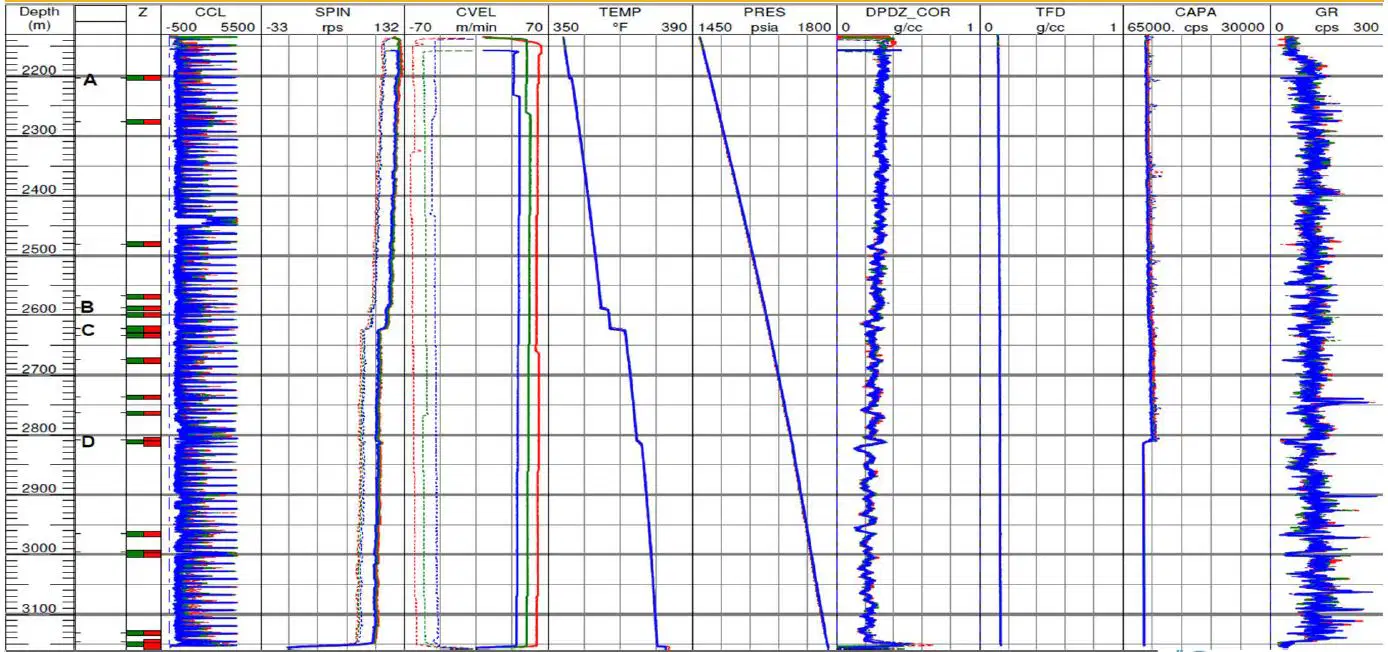
Where is the main source of water?
Sand A
Sand B
Sand C
Sand D
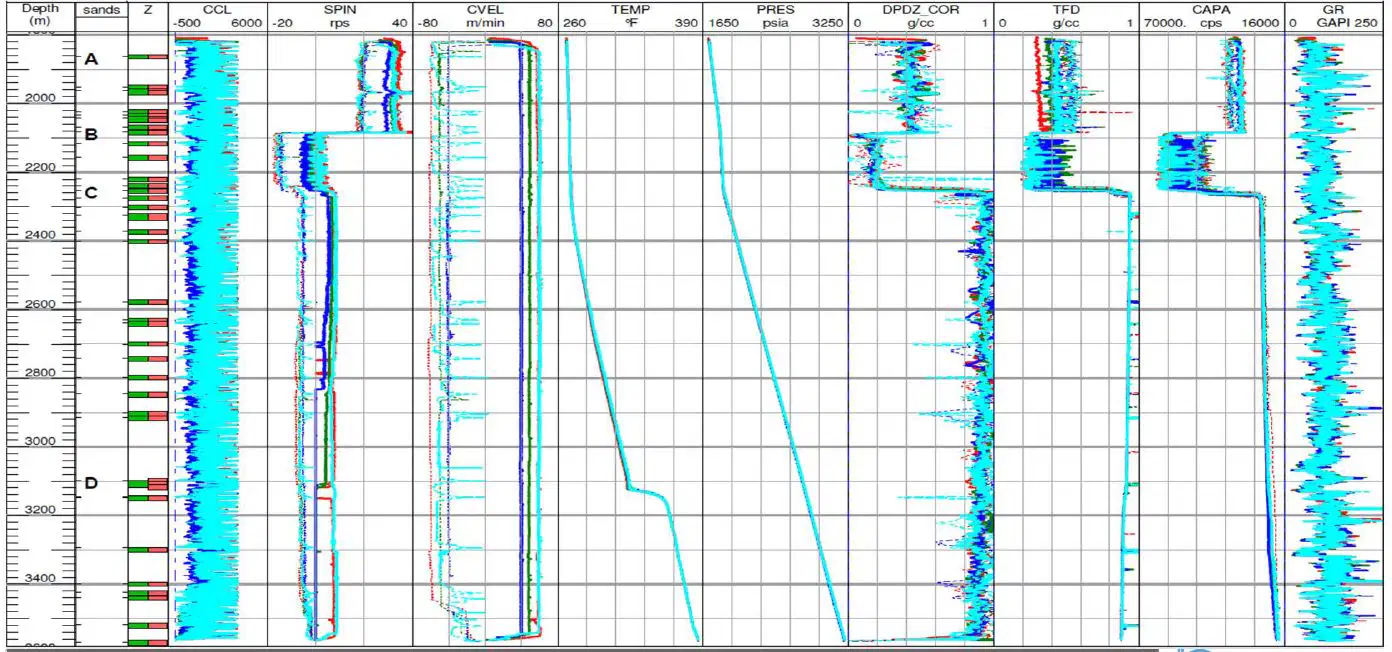
What happened at sand C?
Produce Gas
Produce Water
Thief sand
Produce Oil
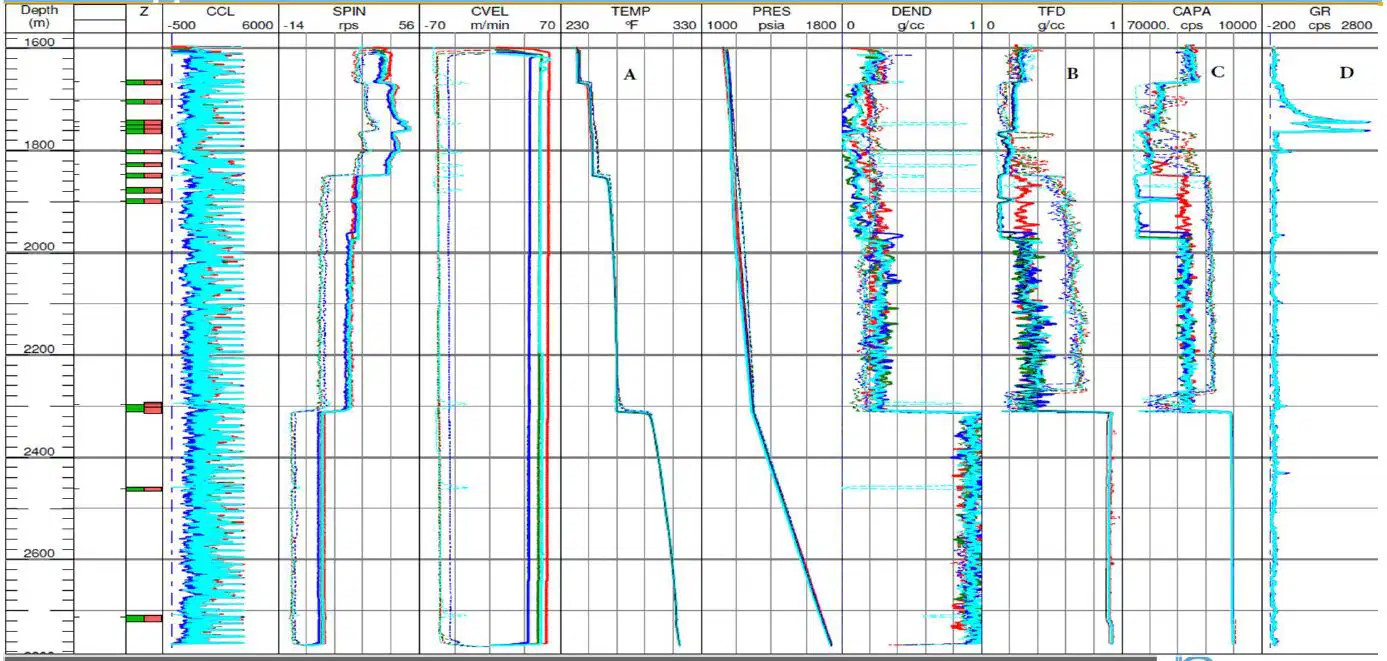
Why did GR show higher count between 1,700 - 1,800 M ?
High GR count from radioactive scale.
GR reading high from Gas contribution.
GR curve indicates shale inflow increasing steadily
GR detector failed and recorded no signal
Propose logging interval for well A?
Objective: Identify water source
Top perf 4220 - 4225 ft.RKB
Bottom perf 8650 - 8654 ft.RKB
Holdup Depth(Bottom depth of Drift run) 8800 ft.RKB
4210 – 8800 ft
3820 – 8800 ft
4020 – 8750 ft
100 – 8750 ft

