
 Worksheets
Getting to know your Data
Total questions: 15
Worksheet time: 8mins
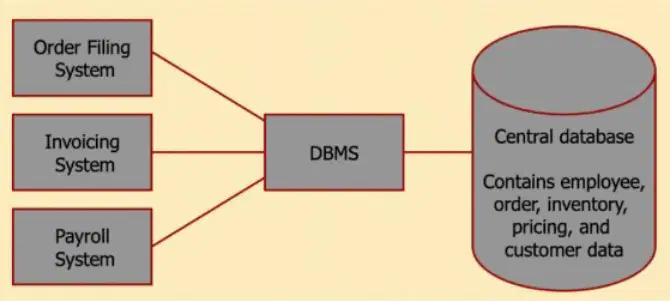
In the diagram, which component connects operational systems to the central database?
Payroll system storing records directly
Central database without middleware
DBMS acting as the interface layer
Order filing system as primary storage
Which of the following is NOT typically cited as structured data in databases?
Dates stored in standard formats
Numbers with validation constraints
Images without tags
Text fields with length limits
Which attribute is typically associated with structured data?
Non-textual social postings
Machine-generated videos
Organized information formats
Diverse media content types
Which is the best example of sequential transaction data?
Daily inventory snapshot table
Consecutive customer purchase event
Doctor roster by specialty
Course catalog by department
Database rows map to data objects. What do columns map to in this context?
transactions over time
attributes of objects
relations between tables
primary keys only
Which is a correct example of attributes for a customer data object?
customer_ID, name, address
Amount paid, change branch
School ID, age, course
sales, amount, name
Why is saying one day is twice as hot as another invalid for Celsius?
Unit steps are unequal
There is no true zero point
Values are unordered
Differences are uninterpretable
Which set of measures are all examples of variability?
Mode, standard score, mean
Median, interquartile mean, mode
Range, quartiles, standard deviation
Mean, median, mode
In a Boxplot (also known as a Box-and-Whisker plot), what specific value is represented by the line located inside the rectangular box?
Q1
Median
Q3
Min
Reviewing a database schema for a logistics company. One column, 'Shipment_Weight', contains values like 10.5kg, 50.0kg, and 0.0kg (representing an empty container). Which measurement scale does this attribute belong to?
Unstructured data with a Ratio-scaled attribute
Structured data with an Interval-scaled attribute
Structured data with a Ratio-scaled attribute.
Unstructured data with an Interval-scaled attribute.
It tells you how much your data points deviate from the Mean (the average).
Variance
Standard Deviation
Median
IQR
This tells you how "spread out" your data points are from the center.
Frequency distribution
Measures of Central Tendency
Measures of Variability
Inferential Statistics
ZIP codes or IP addresses is example of
Discrete Attributes
Continuous Attribute
Ordinal Attribute
Numeric Attribute
This identifies the "center" of your data distribution.
Frequency Distribution
Measures of Central Tendency
Measures of Variability
Inferential Statistics
Key Visualization Techniques for Categorical Data
Line Chart
Box Plot
Pie Chart / Donut Chart
Network Diagram

