

Wayground
Distance/Time versus Speed/Time Motion Graphs - Printable คณิตศาสตร์ Worksheets 6th ระดับชั้น - Wayground

Distance/Time versus Speed/Time Motion Graphs

Ashley Adkins

สร้างโดย Ashley Adkins

24 คำถาม

6th ระดับชั้น

คณิตศาสตร์

แบบฝึกหัดวิทยาศาสตร์สำหรับนักเรียนชั้นประถมศึกษาปีที่ 6 เรื่อง กราฟระยะทาง/เวลา เทียบกับ กราฟความเร็ว/เวลา ประกอบด้วยคำถามแบบเลือกตอบ 24 ข้อ ที่ช่วยพัฒนาความสามารถของนักเรียนในการตีความกราฟการเคลื่อนที่ นักเรียนจะวิเคราะห์ลักษณะของกราฟเพื่อพิจารณาว่าวัตถุนั้นอยู่นิ่ง เคลื่อนที่ด้วยความเร็วคงที่ กำลังเร่งความเร็ว กำลังชะลอความเร็ว หรือระยะทางจากจุดอ้างอิงเปลี่ยนแปลงไป นอกจากนี้ นักเรียนยังเปรียบเทียบความเร็วและความเร่งของวัตถุ ระบุความเร็วเฉลี่ยสูงสุด และอนุมานว่าวัตถุเคลื่อนที่ในระยะทางเดียวกันหรือใช้เวลาเท่ากันหรือไม่ แบบฝึกหัดที่พิมพ์ได้ฟรีนี้ช่วยให้นักเรียนได้ฝึกฝนซ้ำๆ ในการเชื่อมโยงรูปแบบของกราฟกับคำอธิบายการเคลื่อนที่ในชีวิตจริง รวมถึงการหยุด การเคลื่อนที่ไปยังจุดเริ่มต้น และการกลิ้งกลับไปยังจุดเริ่มต้น ใช้สำหรับการฝึกฝนด้วยตนเอง การทบทวนการอ่านกราฟ หรือการประเมินผลระหว่างเรียนหลังจากการสอนเรื่องระยะทาง ความเร็ว และการเคลื่อนที่ มีเฉลยคำตอบครบถ้วนเพื่อให้ครูสามารถตรวจสอบความเข้าใจได้อย่างมีประสิทธิภาพและแก้ไขข้อผิดพลาดในการตีความความชัน ส่วนแนวนอน และระยะทางที่เปลี่ยนแปลงไปตามเวลา

การตั้งค่าแผ่นงาน

ขนาดตัวอักษร

S
M
L
XL
Waygroundแผ่นงาน

Distance/Time versus Speed/Time Motion Graphs

คำถามทั้งหมด: 24

ชื่อ
ระดับ
วันที่
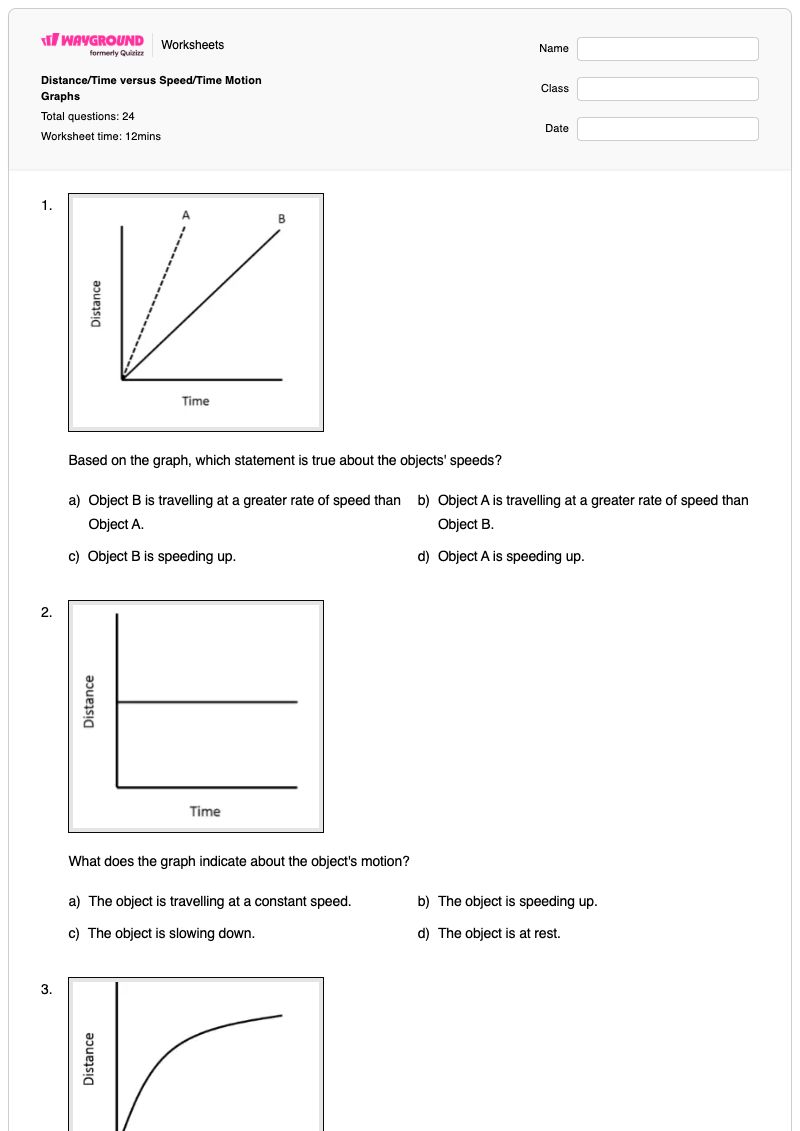
1.
Based on the graph, which statement is true about the objects' speeds?

Based on the graph, which statement is true about the objects' speeds?

a)

Object B is travelling at a greater rate of speed than Object A.

b)

Object A is travelling at a greater rate of speed than Object B.

c)

Object B is speeding up.

d)

Object A is speeding up.

2.
What does the graph indicate about the object's motion?

What does the graph indicate about the object's motion?

a)

The object is travelling at a constant speed.

b)

The object is speeding up.

c)

The object is slowing down.

d)

The object is at rest.

3.
According to the graph, how is the object's speed changing over time?

According to the graph, how is the object's speed changing over time?

a)

The object is travelling at a constant speed.

b)

The object is speeding up.

c)

The object is slowing down.

d)

The object is at rest.

4.
From the graph, which object traveled at the greatest average speed?

From the graph, which object traveled at the greatest average speed?

a)

Object A

b)

Object B

c)

Object C

d)

All objects traveled at the same speed.

5.
What does the graph indicate about the object's movement over time?

What does the graph indicate about the object's movement over time?

a)

The object is speeding up.

b)

The object's distance from a reference point (the start) is decreasing over time.

c)

The object's distance from a reference point (the start) is increasing over time.

d)

The object is slowing down.

6.
What does the graph suggest about the object's movement?

What does the graph suggest about the object's movement?

a)

The object is speeding up.

b)

The object is slowing down.

c)

The object is going up a hill.

d)

The object is travelling at a constant speed.

7.
According to the graph, what is the state of the object(s)?

According to the graph, what is the state of the object(s)?

a)

These objects are travelling at a constant speed.

b)

These objects have stopped in the same location.

c)

One of these objects is travelling faster than the other.

d)

These objects are at rest in different positions.

8.
What can be inferred from the graph about the objects' movement?

What can be inferred from the graph about the objects' movement?

a)

These objects started from different positions.

b)

These objects travelled for the same amount of time.

c)

These objects travelled the same distance.

d)

These objects travelled at the same speed.

9.
What does the graph indicate about the two objects' motion over time?

What does the graph indicate about the two objects' motion over time?

a)

A. The objects were traveling at the same speed but started at different times.

b)

B. The objects were traveling at different speeds.

c)

C. The objects were traveling at the same speed and started at the same time.

d)

D. The objects were speeding up.

10.
What can be inferred from the graph about the object's motion?

What can be inferred from the graph about the object's motion?

a)

A. The object slowed down and stopped.

b)

B. The object maintained a constant speed after slowing down.

c)

C. The object traveled up a hill.

d)

D. The object sped up throughout the graph.

11.
According to the graph, how did the distance traveled by the objects change over time?

According to the graph, how did the distance traveled by the objects change over time?

a)

A. The objects traveled the same distance over time.

b)

B. The objects traveled for the same amount of time.

c)

C. The objects traveled at different speeds.

d)

D. The objects started traveling at different times.

12.
What does the graphsuggest about the object's motion?

What does the graphsuggest about the object's motion?

a)

A. The object traveled up a hill and then down the other side.

b)

B. The object was thrown into the air and landed away.

c)

C. The object traveled up a hill and rolled back to the start.

d)

D. The object sped up and then slowed down.

13.
Examine the graph and choose the statement that most accurately represents the graph.

Examine the graph and choose the statement that most accurately represents the graph.

a)

Object B accelerated at a greater rate than Object A.

b)

Object A accelerated at a greater rate than Object B.

c)

Object B traveled at a constant speed.

d)

Object A traveled at a constant speed.

14.
What does the graph indicate about the object's motion?

What does the graph indicate about the object's motion?

a)

The object is traveling at a constant speed.

b)

The object is speeding up.

c)

The object is slowing down.

d)

The object is at rest.

15.
Analyze the graph to determine the object's motion.

Analyze the graph to determine the object's motion.

a)

The object is traveling at a constant speed.

b)

The object is speeding up.

c)

The object is slowing down.

d)

The object is at rest.

16.
Based on the graph, how did the speed of the objects change over time?

Based on the graph, how did the speed of the objects change over time?

a)

Object A traveled at a constant speed.

b)

Object B traveled at a constant speed and then traveled at a greater constant speed.

c)

Object C traveled at a constant speed for a period of time.

d)

Object C was at rest for a period of time.

17.
What does the graph indicate about the object's motion over time?

What does the graph indicate about the object's motion over time?

a)

The object is speeding up.

b)

The object's distance from a reference point is decreasing over time.

c)

The object's distance from a reference point is increasing over time.

d)

The object is slowing down.

18.
What does the graph suggest about the object's motion?

What does the graph suggest about the object's motion?

a)

The object is speeding up.

b)

The object is slowing down.

c)

The object is going up a hill.

d)

The object is travelling at a constant speed.

19.
According to the graph, what can be inferred about the object's motion?

According to the graph, what can be inferred about the object's motion?

a)

These objects started moving from different positions.

b)

These objects have stopped in the same location.

c)

One of these objects is travelling faster than the other.

d)

These objects are at rest in different positions.

20.
What does the graph indicate about the objects' motion?

What does the graph indicate about the objects' motion?

a)

These objects started from different positions.

b)

These objects travelled for the same amount of time.

c)

These objects accelerated at the same rate.

d)

These objects accelerated at different rates.

21.
What does the graph indicate about the movement of the two objects over time?

What does the graph indicate about the movement of the two objects over time?

a)

These two objects were travelling at the same speed, but began moving at different times.

b)

These two objects were travelling at the same speed, but began from different positions.

c)

These two objects began moving at different speeds.

d)

These two objects are travelling at a constant speed.

22.
What can be inferred from the graph shown?

What can be inferred from the graph shown?

a)

This object slowed down and gradually came to a stop.

b)

This object slowed down and then maintained the same speed.

c)

This object travelled up a hill.

d)

This object sped up at first and then settled into a constant speed.

23.
What does the graph suggest about the movement of the objects?

What does the graph suggest about the movement of the objects?

a)

These objects travelled the same distance.

b)

These objects travelled for the same amount of time.

c)

These objects travelled at the same speed.

d)

These objects began travelling at different times.

24.
How does the graph describe the motion of the object?

How does the graph describe the motion of the object?

a)

This object travelled up a hill and then down the other side.

b)

This object was thrown into the air and landed several meters away.

c)

This object travelled up hill and then rolled back to the starting position.

d)

This object sped up and then slowed down to a stop.

Waygroundแป้นคำตอบ

Distance/Time versus Speed/Time Motion Graphs

คำถามทั้งหมด: 24

1.
b)

Object A is travelling at a greater rate of speed than Object B.

2.
d)

The object is at rest.

3.
c)

The object is slowing down.

4.
a)

Object A

5.
b)

The object's distance from a reference point (the start) is decreasing over time.

6.
a)

The object is speeding up.

7.
d)

These objects are at rest in different positions.

8.
c)

These objects travelled the same distance.

9.
c)

C. The objects were traveling at the same speed and started at the same time.

10.
a)

A. The object slowed down and stopped.

11.
b)

B. The objects traveled for the same amount of time.

12.
c)

C. The object traveled up a hill and rolled back to the start.

13.
b)

Object A accelerated at a greater rate than Object B.

14.
a)

The object is traveling at a constant speed.

15.
b)

The object is speeding up.

16.
c)

Object C traveled at a constant speed for a period of time.

17.
d)

The object is slowing down.

18.
a)

The object is speeding up.

19.
c)

One of these objects is travelling faster than the other.

20.
d)

These objects accelerated at different rates.

21.
c)

These two objects began moving at different speeds.

22.
d)

This object sped up at first and then settled into a constant speed.

23.
b)

These objects travelled for the same amount of time.

24.
d)

This object sped up and then slowed down to a stop.

คำถามที่พบบ่อย

แบบฝึกหัดกราฟแสดงการเคลื่อนที่นี้ครอบคลุมเนื้อหาอะไรบ้าง และช่วยพัฒนาทักษะการอ่านกราฟได้อย่างไร?

แบบฝึกหัดวิทยาศาสตร์ชั้นประถมศึกษาปีที่ 6 นี้ประกอบด้วยคำถามแบบเลือกตอบ 24 ข้อ เพื่อประเมินการตีความกราฟระยะทาง/เวลา และกราฟความเร็ว/เวลา นักเรียนจะได้เชื่อมโยงรูปแบบกราฟกับความเร็วคงที่ การเร่งความเร็ว การลดความเร็ว การหยุดนิ่ง การเปลี่ยนแปลงระยะทางจากจุดอ้างอิง การเปรียบเทียบความเร็วของวัตถุ ความเร่ง และเวลาหรือระยะทางในการเดินทาง การทำแบบฝึกหัดนี้จะช่วยเสริมสร้างความสามารถในการใช้หลักฐานจากกราฟเพื่ออธิบายและเปรียบเทียบการเคลื่อนที่ แทนที่จะอาศัยการคาดเดาด้วยสายตา

ฉันจะใช้แบบฝึกหัดนี้สอนนักเรียนเกี่ยวกับการตีความกราฟแสดงการเคลื่อนที่ในแนวระยะทาง/เวลา และความเร็ว/เวลา ได้อย่างไร?

ขั้นแรก ให้สาธิตวิธีการตรวจสอบความชัน ส่วนแนวนอน และทิศทางของกราฟก่อนที่จะอ่านตัวเลือกคำตอบ จากนั้นให้นักเรียนอธิบายว่ากราฟแต่ละกราฟแสดงถึงการหยุดนิ่ง ความเร็วคงที่ การเร่งความเร็ว การลดความเร็ว หรือการเคลื่อนที่เข้าหาหรือออกจากจุดอ้างอิง ตามด้วยแบบฝึกหัดปรนัย 24 ข้อ ทั้งแบบมีผู้แนะนำหรือแบบทำเอง ขอให้นักเรียนอธิบายเหตุผลของคำตอบเปรียบเทียบโดยใช้หลักฐานจากกราฟ เช่น ทำไมวัตถุหนึ่งจึงมีความเร็วหรือความเร่งมากกว่าอีกวัตถุหนึ่ง

ฉันควรระวังข้อผิดพลาดอะไรบ้างเมื่อนักเรียนทำแบบฝึกหัดกราฟการเคลื่อนที่นี้?

นักเรียนอาจสับสนระหว่างส่วนของกราฟแนวนอนกับความเร็วคงที่ ทั้งที่จริงแล้วกราฟนั้นแสดงถึงวัตถุที่อยู่นิ่ง หรืออาจเข้าใจผิดว่าเส้นกราฟที่ชันกว่าแสดงถึงการเร่งความเร็ว แทนที่จะเป็นอัตราการเคลื่อนที่ที่มากขึ้นหรือเร็วขึ้น นอกจากนี้ พวกเขายังอาจสับสนระหว่างระยะทางที่เพิ่มขึ้นหรือลดลงจากจุดเริ่มต้นกับการเร่งความเร็วหรือการชะลอความเร็ว และอาจสับสนว่าวัตถุเคลื่อนที่ในระยะทางเดียวกัน ใช้เวลาเท่ากัน หรือเริ่มต้นพร้อมกันหรือไม่ ควรทบทวนแกนของกราฟและการเปลี่ยนแปลงความชันก่อนที่จะให้นักเรียนเลือกคำตอบ

ฉันจะมอบหมายและให้คะแนนแบบฝึกหัดกราฟการเคลื่อนที่นี้ได้อย่างไร?

แบบฝึกหัดนี้มีให้เลือกทั้งในรูปแบบไฟล์ PDF ที่สามารถพิมพ์ได้ และแบบทดสอบดิจิทัลบน Wayground พร้อมเฉลยคำตอบครบถ้วนสำหรับคำถามแบบเลือกตอบทั้ง 24 ข้อ สำหรับการส่งงานแบบพิมพ์ คุณสามารถตรวจงานของนักเรียนได้โดยการสแกนด้วยแอป Wayground for Teachers นอกจากนี้ ตัวเลือก PDF ยังสามารถช่วยสนับสนุนห้องเรียนที่ลดเวลาการใช้หน้าจอในขณะที่นักเรียนฝึกฝนการตีความกราฟการเคลื่อนที่ได้อีกด้วย

ฉันจะปรับแบบฝึกหัดกราฟการเคลื่อนที่นี้ให้เหมาะสมกับนักเรียนของฉันได้อย่างไร?

ใช้การตั้งค่าขั้นสูงของแบบฝึกหัดเพื่อปรับระยะห่างระหว่างตัวอักษรและขนาดตัวอักษร เพื่อให้คำถามและตัวเลือกคำตอบที่เกี่ยวกับกราฟอ่านง่ายขึ้น นอกจากนี้ คุณยังสามารถใช้แบบอักษรที่เหมาะสำหรับผู้ที่มีภาวะดิสเล็กเซีย หรือแปลแบบฝึกหัดเป็นภาษาอื่นได้ ตัวเลือกเหล่านี้จะช่วยให้คำถามและการเปรียบเทียบเกี่ยวกับกราฟเคลื่อนไหวเข้าถึงได้ง่ายขึ้น โดยไม่เปลี่ยนแปลงทักษะที่กำลังประเมิน

ฉันจะหาแบบฝึกหัดแบบนี้เพิ่มเติมได้ที่ไหนบน Wayground?

Wayground นำเสนอชุดแบบฝึกหัดและโจทย์ฝึกหัดฟรีที่ครอบคลุมทุกวิชา พร้อมไฟล์ PDF และเฉลยคำตอบ เพื่อช่วยให้นักเรียนเชี่ยวชาญทักษะและแนวคิดที่สำคัญ ดูแหล่งข้อมูลเพิ่มเติมได้ที่ https://wayground.com/en-us/worksheets