
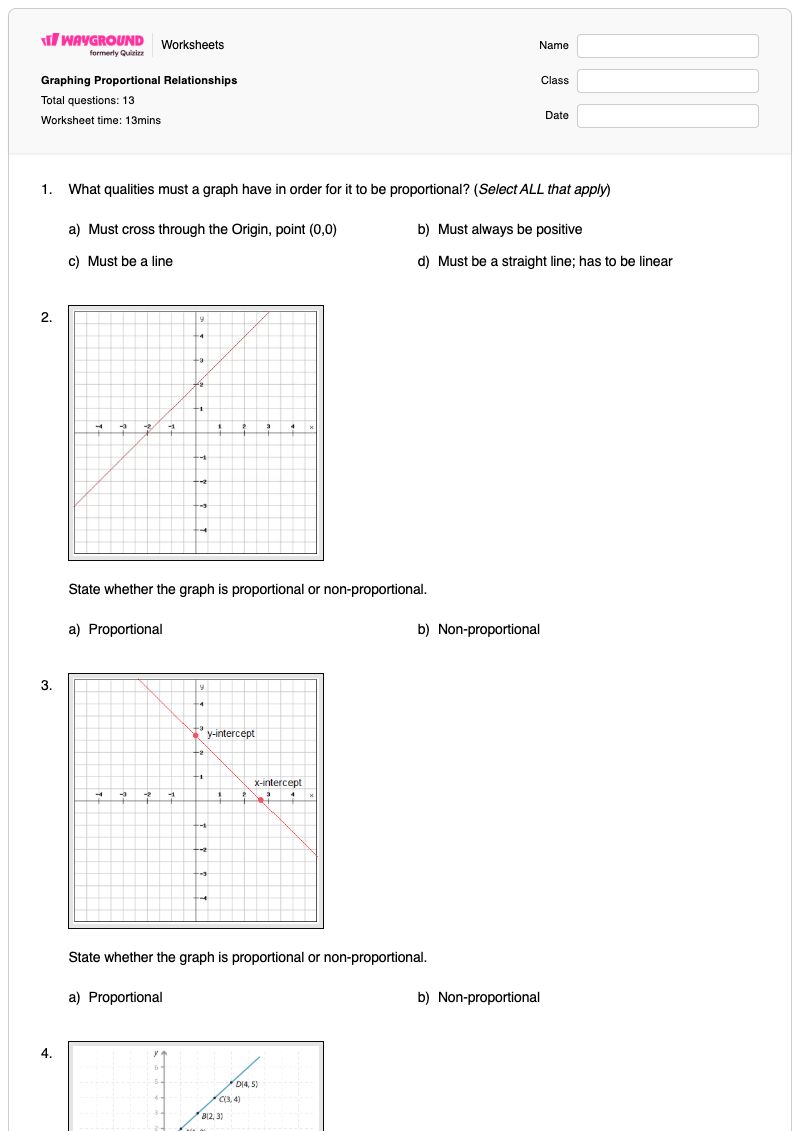

What qualities must a graph have in order for it to be proportional? (Select ALL that apply)
a)
Must cross through the Origin, point (0,0)
b)
Must always be positive
c)
Must be a line
d)
Must be a straight line; has to be linear
2.
State whether the graph is proportional or non-proportional.
a)
Proportional
b)
Non-proportional
3.
State whether the graph is proportional or non-proportional.
a)
Proportional
b)
Non-proportional
4.
State whether the graph is proportional or non-proportional.
a)
Proportional
b)
Non-proportional
5.
State whether the graph is proportional or non-proportional.
a)
Proportional
b)
Non-proportional
6.
State whether the graph is proportional or non-proportional.
a)
Proportional
b)
Non-proportional
7.
State whether the graph is proportional or non-proportional.
a)
Proportional
b)
Non-proportional
8.
State whether the graph is proportional or non-proportional.
a)
Proportional
b)
Non-proportional
9.
Which line represents a proportional relationship? (Select ALL that apply)
a)
Blue Line A
b)
Red Line B
c)
Green Line C
10.
Which of the following data matches the graph:
a)
30 mass (m/kg) for every 2 extension (e/mm)
b)
8 mass (m/kg) for every 120 mass (m/kg)
c)
2 mass (m/kg) for every 30 extension (e/mm)
d)
120 mass (m/kg) for every 8 extension (e/mm)
11.
Which of the following graphs demonstrates a proportional relationship? (Select ALL that apply)
a)
b)
c)
d)
12.
Which of the following graphs demonstrates a non-proportional relationship? (Select ALL that apply)
a)
b)
c)
d)
13.
Which of the following graphs represents the following scenario:
On a school field trip to the zoo, each student was allowed to choose 2 animals that they wished to observe. How many animals can the class observe, if each student chose 2 unique animals (no repeats were allowed).