

Wayground
Earth Science Prologue Practice - Printable ศาสตร์ Worksheets ระดับ 9 - Wayground

Earth Science Prologue Practice

Christine Malloy

สร้างโดย Christine Malloy

61 คำถาม

9th ระดับชั้น

ศาสตร์

อัปเดตแล้ว ก.ย. 2569

แบบฝึกหัดวิทยาศาสตร์โลกเบื้องต้นสำหรับนักเรียนชั้นมัธยมศึกษาปีที่ 3 (เกรด 3) ช่วยสร้างทักษะพื้นฐานในการตีความข้อมูลทางวิทยาศาสตร์ นักเรียนจะได้แยกแยะความแตกต่างระหว่างการสังเกตเชิงคุณภาพและการสังเกตเชิงปริมาณ ระบุข้อสรุปที่ได้จากการสังเกต และจัดประเภทตัวอย่างต่างๆ เช่น คำอธิบาย การวัด และข้อสรุป แบบฝึกหัดนี้ยังแนะนำการให้เหตุผลทางวิทยาศาสตร์กายภาพที่เกี่ยวข้อง เช่น ความหนาแน่น และการจดจำรูปแบบในกราฟ แบบฝึกหัด 61 ข้อนี้ประกอบด้วยคำถามแบบเลือกตอบ 52 ข้อ คำถามเกี่ยวกับการจัดประเภท 1 ข้อ คำถามเติมคำในช่องว่าง 7 ข้อ และคำถามแบบเลือกคำตอบ 1 ข้อ ออกแบบมาเพื่อทบทวนวิทยาศาสตร์โลกเบื้องต้น ตรวจสอบความเข้าใจ การฝึกฝนด้วยตนเอง หรือเสริมบทเรียน แบบฝึกหัดที่พิมพ์ได้ฟรีนี้มีเฉลยคำตอบครบถ้วน ทำให้ครูสามารถตรวจสอบความเข้าใจของนักเรียนเกี่ยวกับการให้เหตุผลจากการสังเกตและแนวคิดวิทยาศาสตร์เบื้องต้นที่เกี่ยวข้องได้อย่างสะดวก

การตั้งค่าแผ่นงาน

ขนาดตัวอักษร

S
M
L
XL
Waygroundแผ่นงาน

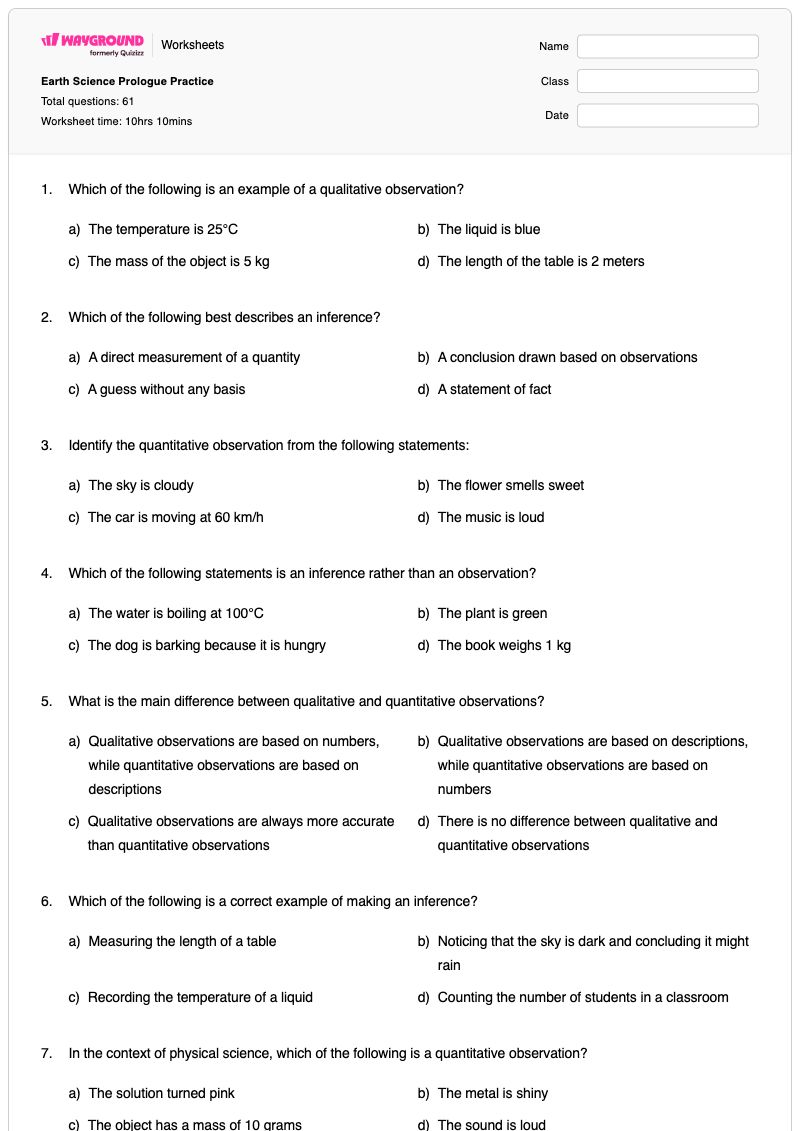
Earth Science Prologue Practice

คำถามทั้งหมด: 61

ชื่อ
ระดับ
วันที่
1.

Which of the following is an example of a qualitative observation?

a)

The temperature is 25°C

b)

The liquid is blue

c)

The mass of the object is 5 kg

d)

The length of the table is 2 meters

2.

Which of the following best describes an inference?

a)

A direct measurement of a quantity

b)

A conclusion drawn based on observations

c)

A guess without any basis

d)

A statement of fact

3.

Identify the quantitative observation from the following statements:

a)

The sky is cloudy

b)

The flower smells sweet

c)

The car is moving at 60 km/h

d)

The music is loud

4.

Which of the following statements is an inference rather than an observation?

a)

The water is boiling at 100°C

b)

The plant is green

c)

The dog is barking because it is hungry

d)

The book weighs 1 kg

5.

What is the main difference between qualitative and quantitative observations?

a)

Qualitative observations are based on numbers, while quantitative observations are based on descriptions

b)

Qualitative observations are based on descriptions, while quantitative observations are based on numbers

c)

Qualitative observations are always more accurate than quantitative observations

d)

There is no difference between qualitative and quantitative observations

6.

Which of the following is a correct example of making an inference?

a)

Measuring the length of a table

b)

Noticing that the sky is dark and concluding it might rain

c)

Recording the temperature of a liquid

d)

Counting the number of students in a classroom

7.

In the context of physical science, which of the following is a quantitative observation?

a)

The solution turned pink

b)

The metal is shiny

c)

The object has a mass of 10 grams

d)

The sound is loud

8.

Observations are based on direct sensory experiences.

a)

True

b)

False

9.

Read the examples and decide if each is a QUALITATIVE or QUANTITATIVE observation.

จัดหมวดหมู่ดังต่อไปนี้

The candy was sour.

The bug was 5 cm long.

The temperature outside is 25 degrees Celcius.

It is warm outside.

The tree is 30 feet tall.

The building is taller than the tree.

The building has 25 stories.

The back of the starfish felt very rough.

Greg has three sisters.

The leaf is light green in color.

Qualitative Observation
Quantitative Observation
10.
Qualitative or Quantitative: The cat has orange fur on his ears.
Qualitative or Quantitative:
The cat has orange fur on his ears. 
a)
Qualitative
b)
Quantitative
11.
The person in the picture is a man

The person in the picture is a man

a)

Observation

b)

Inference

12.
The person in the picture is wearing shoes (or some form of footwear).

The person in the picture is wearing shoes (or some form of footwear).

a)

Observation

b)

Inference

13.
The boy broke the branch.
a)
Observation
b)
Inference
14.

An object with an extremely high mass and a very small volume would have

a)

a very low density

b)

a very high density

c)

a density that cannot be calculated

d)

a rate that is very large

15.

Which graph most likely illustrates a cyclic change?

a)
Which graph most likely illustrates a cyclic change?
b)
Which graph most likely illustrates a cyclic change?
c)
Which graph most likely illustrates a cyclic change?
d)
Which graph most likely illustrates a cyclic change?
16.

Using a ruler to measure the length of a stick is an example of

a)

predicting the length of the stick by guessing

b)

extending the sense of sight by using an instrument

c)

calculating the percent of error by using a proportion

d)

measuring the rate of change of the stick by making inferences

17.

A student earned a 90% the first marking period, but only a 75% the second marking period. What was the weekly rate of change over the 10 week marking period?

a)

15% / week

b)

1.5% / week

c)

9% / week

d)

7.5% / week

18.

Which statement about a major hurricane is an inference?

a)

The windspeed is measured at 200 km/hr.

b)

The central air pressure is recorded at 946.0 mb.

c)

A rain gauge records three inches of rain in less than one hour.

d)

Damage from the storm is expected to be extensive.

19.
The graph shows temperature readings for a day in April. The average rate of temperature change, in Fahrenheit degrees per…

The graph shows temperature readings for a day in April. The average rate of temperature change, in Fahrenheit degrees per hour, between 6 a.m. and noon was

a)

6°/hr

b)

8°/hr

c)

3°/hr

d)

18°/hr

20.

The primary purpose of a classification system is to enable people to

a)

make measurements that are very accurate

b)

eliminate inaccurate inferences

c)

organize observations in a meaningful way

d)

extend their powers of observation

21.

Using similarities based on observations to place objects into

groups.

a)

Engineering:

b)

Dynamic Equilibrium:

c)

Classification:

d)

Inference:

22.

An orderly change in the environment that repeats. Ex. Day/night,

seasons.

a)

Engineering:

b)

Dynamic Equilibrium:

c)

Measurement:

d)

Cyclic Change:

23.

a balance between two opposing forces. Ex. Water in a

lake.

a)

Engineering:

b)

Dynamic Equilibrium:

c)

Classification:

d)

Inference:

24.

An educated guess based on observations.

a)

Observation:

b)

Instrument:

c)

Measurement:

d)

Inference:

25.

A man-made device that extends the senses beyond their normal

limits, and make our observations more accurate.

a)

Instrument::

b)

Dynamic Equilibrium:

c)

Classification:

d)

Inference:

26.

A way of expressing an observation with greater accuracy or

precision. They are based on a known standard. ex. foot, minute.

a)

Rate of Change:

b)

Mass:

c)

Measurement:

d)

Volume:

27.

Information or facts received from any of our 5 senses.

a)

Rate of Change:

b)

Mass:

c)

Measurement:

d)

Observation:

28.

How much (quickly or slowly) something (field value) changes

over time.

a)

Rate of Change:

b)

Scientific Notation:

c)

Measurement:

d)

Observation:

29.

An observer recorded the times of three successsive high tides at one Earth locations as:

  • 7:12 am
  • 7:38 pm
  • 8:04 am

What was the time of the next high tide?

a)

8:12 pm

b)

8:30 pm

c)

8:38 pm

d)

9:04 pm

30.
The graph below shows temperature readings for a day in April. The average rate of temperature change, in Fahrenheit degrees…

The graph below shows temperature readings for a day in April.

The average rate of temperature change, in Fahrenheit degrees per hour, between 6 am and noon was

a)

6o/hr

b)

8o/hr

c)

3o/hr

d)

18o/hr

31.
The grade shows that high tides at Boston occur approximately every

The grade shows that high tides at Boston occur approximately every

a)

3.5 hours

b)

6.0 hours

c)

12.5 hours

d)

16.0 hours

32.

The rising and setting of the Sun are examples of

a)

noncylcic events

b)

unrelated events

c)

predictable changes

d)

random motion

33.

Which graph most likely illustrates a cyclic change?

a)
Which graph most likely illustrates a cyclic change?
b)
Which graph most likely illustrates a cyclic change?
c)
Which graph most likely illustrates a cyclic change?
d)
Which graph most likely illustrates a cyclic change?
34.
The rate of temperature change for the water in cup A for the first 10 minutes was approximately

The rate of temperature change for the water in cup A for the first 10 minutes was approximately

a)

0.77 oC/min

b)

1.3 oC/min

c)

7.7 oC/min

d)

13.0 oC/min

35.

Which graph best represents the relationship between the density of a substance and its state of matter (phase) for most earth materials, excluding water?

a)
Which graph best represents the relationship between the density of a substance and its state of matter (phase) for most…
b)
Which graph best represents the relationship between the density of a substance and its state of matter (phase) for most…
c)
Which graph best represents the relationship between the density of a substance and its state of matter (phase) for most…
d)
Which graph best represents the relationship between the density of a substance and its state of matter (phase) for most…
36.

Which statement about a major hurricane is an inference?

a)

The windspeed is measured at 200 km/hr.

b)

The central air pressure is recorded at 946.0 mb.

c)

A rain gauge records three inches of rain in less than one hour.

d)

Damage from the storm is expected to be extensive.

37.

The primary purpose of a classification system is to enable people to

a)

make measurements that are very accurate

b)

eliminate inaccurate inferences

c)

organize observations in a meaningful way

d)

extend their powers of observation

38.

Which of the following is NOT an example of Quantitave data?

a)

45 minutes

b)

6.2 meters

c)

shiny and smooth

d)

80 degrees

39.

(def.) information gathered through the use of the five senses (sight, touch, taste, smell, and hearing)

a)

Observation

b)

Inference

40.

(def.) scientists draw conclusions based on observations

a)

Observation

b)

Inference

41.

(def.) an observation made with an instrument consisting of a number and unit

(a)  

42.

(def.) an observation made with an instrument consisting of a number and unit

a)

Instrument

b)

Unit

43.

(def.) a word, symbol, or abbreviation that states which property is being measured

a)

Instrument

b)

Unit

44.

(def.) an inference about future events

(a)  

45.

(def.) occurs in a pattern and are predictable

a)

Cyclic Events

b)

Non-cyclic Events

46.

(def.) scientists organize observations in a meaningful way by grouping objects with similar characteristics

(a)  

47.
ภาพคำถาม


(a)  

48.
ภาพคำถาม


(a)  

49.
ภาพคำถาม


(a)  

50.

(def.) how fast or slow a change occurs

(a)  

51.
Which statement correctly describes the relationship between the variables on the graph?

Which statement correctly describes the relationship between the variables on the graph?

a)

As density increases, water vapor content decreases

b)

As water vapor content increases, density decreases

c)

As water vapor content increases, density increases

d)

As water vapor content increases, density stays the same

52.

Which graph most likely illustrates an constant relationship?

a)
Which graph most likely illustrates an constant relationship?
b)
Which graph most likely illustrates an constant relationship?
c)
Which graph most likely illustrates an constant relationship?
d)
Which graph most likely illustrates an constant relationship?
53.

Which graph most likely illustrates an inverse relationship?

a)
Which graph most likely illustrates an inverse relationship?
b)
Which graph most likely illustrates an inverse relationship?
c)
Which graph most likely illustrates an inverse relationship?
d)
Which graph most likely illustrates an inverse relationship?
54.

Which graph most likely illustrates a direct relationship?

a)
Which graph most likely illustrates a direct relationship?
b)
Which graph most likely illustrates a direct relationship?
c)
Which graph most likely illustrates a direct relationship?
d)
Which graph most likely illustrates a direct relationship?
55.

A 50.0 gram sample of halite was placed in a jar with five other mineral samples and water. the jar was shaken vigorously for 5 minutes. The halite sample was then found to have a mass of 40.0 grams. What was the rate of weathering of the halite sample?

a)

0.50 g/min

b)

2.0 g/min

c)

3.0 g/min

d)

10.0 g/min

56.

Which graph most likely illustrates a cyclic change?

a)
Which graph most likely illustrates a cyclic change?
b)
Which graph most likely illustrates a cyclic change?
c)
Which graph most likely illustrates a cyclic change?
d)
Which graph most likely illustrates a cyclic change?
57.

While in the classroom during a visual inspection of a rock, a student recorded four statements about the rock. Which statement about the rock is an observation?

a)

The rock formed deep in the Earth's interior

b)

The rock cooled very rapidly

c)

The rock dates from the Precambrian Era

d)

The rock is black and shiny

58.

Cyclic events are

a)

predictable because they repeat in a pattern.

b)

unpredictable because they occur randomly.

59.

Which are examples of cyclic changes? Choose all that are correct.

a)

Tides

b)

Temperatures over several days.

c)

Precipitation over several weeks.

d)

Temperatures over several years.

60.

A baby penguin has a mass of 0.4 kg. 4 months later its mass is 3.2 kg. What is its rate of increase in mass? _____kg/month

a)

2.8

b)

0.7

c)

0.8

d)

0.1

61.

Bob turns on his oven and it heats up from 72.2°F to 350.0°F in 21.0 minutes. What is the rate of temperature change? _____°F/hr

a)

277.8

b)

13.2

c)

16.7

d)

3.4

Waygroundแป้นคำตอบ

Earth Science Prologue Practice

คำถามทั้งหมด: 61

1.
b)

The liquid is blue

2.
b)

A conclusion drawn based on observations

3.
c)

The car is moving at 60 km/h

4.
c)

The dog is barking because it is hungry

5.
b)

Qualitative observations are based on descriptions, while quantitative observations are based on numbers

6.
b)

Noticing that the sky is dark and concluding it might rain

7.
c)

The object has a mass of 10 grams

8.
a)

True

9.
Qualitative Observation

The candy was sour.

It is warm outside.

The building is taller than the tree.

The back of the starfish felt very rough.

The leaf is light green in color.

Quantitative Observation

The bug was 5 cm long.

The temperature outside is 25 degrees Celcius.

The tree is 30 feet tall.

The building has 25 stories.

Greg has three sisters.

10.
a) Qualitative
11.
b)

Inference

12.
a)

Observation

13.
b) Inference
14.
b)

a very high density

15.
d)
16.
b)

extending the sense of sight by using an instrument

17.
b)

1.5% / week

18.
d)

Damage from the storm is expected to be extensive.

19.
c)

3°/hr

20.
c)

organize observations in a meaningful way

21.
c)

Classification:

22.
d)

Cyclic Change:

23.
b)

Dynamic Equilibrium:

24.
d)

Inference:

25.
a)

Instrument::

26.
c)

Measurement:

27.
d)

Observation:

28.
a)

Rate of Change:

29.
b)

8:30 pm

30.
c)

3o/hr

31.
c)

12.5 hours

32.
c)

predictable changes

33.
d)
34.
b)

1.3 oC/min

35.
b)
36.
d)

Damage from the storm is expected to be extensive.

37.
c)

organize observations in a meaningful way

38.
c)

shiny and smooth

39.
a)

Observation

40.
b)

Inference

41.
Measurement
42.
a)

Instrument

43.
b)

Unit

44.
Prediction
45.
a)

Cyclic Events

46.
Classification
47.
Cyclic
48.
Direct
49.
Indirect (inverse)
50.
Rate Of Change
51.
b)

As water vapor content increases, density decreases

52.
c)
53.
b)
54.
a)
55.
b)

2.0 g/min

56.
d)
57.
d)

The rock is black and shiny

58.
a)

predictable because they repeat in a pattern.

59.
d)

Temperatures over several years.

, b)

Temperatures over several days.

, a)

Tides

60.
b)

0.7

61.
b)

13.2

คำถามที่พบบ่อย

แบบฝึกหัดบทนำวิชาธรณีวิทยาครอบคลุมเนื้อหาอะไรบ้าง?

แบบฝึกหัดวิทยาศาสตร์ระดับชั้น ม.3 นี้ฝึกฝนการแยกแยะความแตกต่างระหว่างการสังเกตเชิงคุณภาพ การสังเกตเชิงปริมาณ และการอนุมาน แบบฝึกหัด 61 ข้อใช้รูปแบบปรนัย การจำแนกประเภท การเติมคำในช่องว่าง และการเลือกหลายข้อ เพื่อให้นักเรียนระบุคำอธิบาย เช่น สี การวัด เช่น มวลหรืออุณหภูมิ และข้อสรุปที่ได้จากหลักฐาน นอกจากนี้ แบบฝึกหัดหลายข้อยังประยุกต์ใช้หลักการคิดเชิงฟิสิกส์เบื้องต้นกับความหนาแน่นและรูปแบบกราฟด้วย

ฉันจะใช้แบบฝึกหัดนี้ในการสอนเรื่องการสังเกตและการอนุมานได้อย่างไร?

เริ่มบทเรียนโดยการสาธิตวิธีการที่นักเรียนสามารถบันทึกคำอธิบายหรือการวัดทางประสาทสัมผัสโดยตรงก่อนที่จะสรุปผล จากนั้นให้นักเรียนอธิบายว่าทำไมตัวอย่างเช่น ของเหลวที่มีสีฟ้าจึงเป็นการสังเกต ในขณะที่การตัดสินว่าสุนัขเห่าเพราะหิวเป็นการอนุมาน ใช้สิ่งของสำหรับการจำแนกประเภทเป็นกิจกรรมกลุ่ม ตามด้วยคำถามแบบเลือกตอบเป็นแบบฝึกหัดและการอภิปรายรายบุคคล

ฉันควรสังเกตข้อผิดพลาดอะไรบ้างเมื่อนักเรียนทำแบบฝึกหัดนี้เสร็จ?

นักเรียนอาจระบุข้อความใดๆ ที่ฟังดูสมเหตุสมผลว่าเป็นข้อสังเกต แม้ว่าข้อความนั้นจะสรุปเกี่ยวกับสาเหตุหรือตัวตนโดยไม่มีหลักฐานสนับสนุนก็ตาม พวกเขายังอาจสลับหมวดหมู่เชิงคุณภาพและเชิงปริมาณโดยการใช้คำอธิบาย เช่น สี หรือ พื้นผิว เป็นการวัด หรือมองข้ามตัวเลขที่ทำให้ข้อสังเกตนั้นเป็นเชิงปริมาณ ในงานการจำแนกประเภท ให้ถามนักเรียนว่าข้อความนั้นเป็นคำอธิบาย การวัด หรือข้อสรุป ก่อนที่จะเลือกหมวดหมู่

ฉันจะมอบหมายและให้คะแนนแบบฝึกหัดบทนำวิชาวิทยาศาสตร์โลกนี้ได้อย่างไร?

Wayground จัดเตรียมแบบฝึกหัดนี้ในรูปแบบไฟล์ PDF ที่สามารถพิมพ์ได้ และในรูปแบบแบบทดสอบดิจิทัล โดยมีเฉลยคำตอบครบถ้วนสำหรับตรวจสอบคำตอบของข้อสอบแบบเลือกตอบ การจำแนกประเภท การเติมคำในช่องว่าง และการเลือกหลายรายการ การส่งงานในรูปแบบไฟล์พิมพ์สามารถตรวจได้โดยการสแกนงานของนักเรียนด้วยแอป Wayground for Teachers ในขณะที่เวอร์ชันดิจิทัลรองรับการส่งงานและการรวบรวมคำตอบทางออนไลน์

ฉันจะปรับแบบฝึกหัดการสังเกตและการอนุมานนี้ให้เหมาะสมกับนักเรียนของฉันได้อย่างไร?

ในการตั้งค่าขั้นสูงของแบบฝึกหัด ให้ปรับระยะห่างระหว่างตัวอักษรหรือเลือกขนาดตัวอักษรที่ใหญ่ขึ้นเพื่อให้ข้อความการจำแนกประเภทและตัวเลือกคำตอบอ่านง่ายขึ้น นอกจากนี้ คุณยังสามารถใช้แบบอักษรที่เหมาะสำหรับผู้ที่มีภาวะดิสเล็กเซีย หรือแปลแบบฝึกหัดเป็นภาษาอื่นได้ เมื่อตัวเลือกเหล่านั้นช่วยให้เข้าถึงงานที่เกี่ยวข้องกับการเปรียบเทียบเชิงคุณภาพกับเชิงปริมาณ และการสังเกตกับการอนุมานได้

ฉันจะหาแบบฝึกหัดฟรีแบบนี้เพิ่มเติมได้ที่ไหนบน Wayground?

Wayground มีแบบฝึกหัดและโจทย์ฝึกหัดมากมายให้ดาวน์โหลดฟรีในหลากหลายวิชา พร้อมไฟล์ PDF และเฉลยคำตอบ เพื่อช่วยให้นักเรียนพัฒนาทักษะและความเข้าใจในแนวคิดที่สำคัญ ดูแหล่งข้อมูลเพิ่มเติมได้ที่ https://wayground.com/en-us/worksheets