
Wayground
Linear Tables, Graphs, and Equations - Printable Mathematics Worksheets ระดับ 7 - Wayground

Linear Tables, Graphs, and Equations

18 คำถาม

7th - 7th ระดับชั้น

Mathematics

ตาราง กราฟ และสมการเชิงเส้น เป็นแบบฝึกหัดคณิตศาสตร์สำหรับนักเรียนชั้น ม.1 จำนวน 18 ข้อ ที่เน้นการเชื่อมโยงความสัมพันธ์เชิงเส้น นักเรียนจะได้จับคู่ตารางและกราฟกับสมการ ระบุอัตราการเปลี่ยนแปลงหรืออัตราต่อหน่วย พิจารณาว่าความสัมพันธ์เป็นสัดส่วนหรือไม่ และตีความความหมายของสัมประสิทธิ์และค่าคงที่ แบบฝึกหัดนี้ยังนำทักษะเหล่านี้ไปใช้ในบริบทที่คุ้นเคย เช่น อัตราค่าพิมพ์ ค่าจ้าง ค่าโดยสารรถแท็กซี่ ค่าเช่าลูกกอล์ฟ เงินออม และการกำหนดราคาตามน้ำหนัก นักเรียนเลือกสมการที่แสดงถึงความแปรผันโดยตรงและสถานการณ์ที่มีค่าเริ่มต้น ช่วยให้พวกเขาสามารถแยกแยะอัตราจากจำนวนเริ่มต้นและแปลบริบทเป็นสมการเชิงเส้นได้ แบบฝึกหัดที่พิมพ์ได้ฟรีนี้มีเฉลยคำตอบครบถ้วนสำหรับการทบทวนอย่างมีประสิทธิภาพ การฝึกฝนด้วยตนเอง การบ้าน หรือการตรวจสอบความเข้าใจของนักเรียนชั้น ม.1

การตั้งค่าแผ่นงาน

ขนาดตัวอักษร

S
M
L
XL
แผ่นงาน

Linear Tables, Graphs, and Equations

คำถามทั้งหมด: 18

ชื่อ
ระดับ
วันที่
1.
Which equation matches the table?
a)
y = x + 5
b)
y = 5x
c)
y = x - 5
d)
x = y - 5
2.
Nancy can type 50 words per minute. Look at the table below to write an equation that matches the data.
a)
m=50 + w
b)
w= 50m
c)
w= 50 + m
d)
m= 50 - w
3.
Choose the best explaination
a)
Taylor can write 6 words per minute
b)
Taylor can write 25 words per minute
c)
Taylor can write 50 words per minute
d)
Taylor can write 150 words per minute
4.
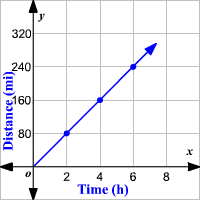
What is the rate of change (unit rate) for the following graph?
a)
80
b)
20
c)
40
d)
160
5.
Is the graph proportional or non proportional?
a)
proportional
b)
non proportional
c)
both
d)
neither
6.
What is the equation of the line?
a)
y = 20x
b)
y = x + 20
c)
y = 2x
d)
y = x + 2
7.
A driving range charges $4 to rent a golf club plus $2.75 for every bucket of golf balls you hit. Write an equation that shows the total cost c of hitting b buckets of golf balls.
a)
c = 2.75b + 4
b)
c = 2.75b
c)
c =  4b- 2.75
d)
c = 2.75b - 4
8.
You earn $18 for every hour you work. Which equation represents this function?
a)
y=(18/2)x + 0
b)
y = 18x
c)
y = 2x + 18
d)
y = 18x + 2
9.
You are visiting Houston, Texas and a taxi cab company charges a flat rate of $4.00 for using the cab and $0.95 per mile.  Write an equation to determine the cost when x miles is driven.
a)
y = .75x
b)
y = .95x
c)
y = .95x + 4
d)
y=4.95x
10.
The number of trees and the number of apples are given in the table above.  Determine which statement below is correct.
a)
The table is not proportional because the unit rate is not constant.
b)
The table is proportional and the unit rate is 1/13
c)
The table is proportional and the unit rate is 13.
d)
The table is not proportional because it doesn't pass through the origin.
11.
Write an equation from the graph using (p) for price and (w) for weight.
a)
p = 20w
b)
w = 20p
c)
p = 20p
d)
w = 20w
12.

The money I have is represented by the equation:

y = 10x + 100 where x = number of weeks and y = money remaining.


How does my money CHANGE each week?

a)

increases by $10 each week

b)

decreases by $10 each week

c)

increases by $100 each week

d)

decreases by $100 each week

13.

What is the rate of change for the following graph?

a)

80

b)

20

c)

40

d)

160

14.

What is the correct equation for the graph?

a)

y = x + 5

b)

x = y

c)

y = 5x

d)

x = 5y

15.

Jack wants to save up money to buy his math teacher a new calculator for the holidays.


He saves $12 per week. He started off with $30 in his savings. What would be the linear equation to represent this situation?

a)

y=12x

b)

y=12x+30

c)

y=42x

d)

y=30x+12

16.
a)

Becky's Shower

b)

Rachel's Shower

c)

They use the same amount of water

17.
Which panda will weigh more at 5 weeks?
a)
Mochi
b)
Kappa
c)
Po the dragon warrior
d)
Jack Black
18.

The table shows the relationship between y, the cost to rent a boat, and x, the amount of time the boat is rented. Which graph best represents the relationship between x and y shown in the table? (7.7A)

a)
b)
c)
d)
แป้นคำตอบ

Linear Tables, Graphs, and Equations

คำถามทั้งหมด: 18

1.
a) y = x + 5
2.
b) w= 50m
3.
b) Taylor can write 25 words per minute
4.
c) 40
5.
a) proportional
6.
c) y = 2x
7.
a) c = 2.75b + 4
8.
b) y = 18x
9.
c) y = .95x + 4
10.
a) The table is not proportional because the unit rate is not constant.
11.
a) p = 20w
12.
a)

increases by $10 each week

13.
c)

40

14.
c)

y = 5x

15.
b)

y=12x+30

16.
a)

Becky's Shower

17.
a) Mochi
18.
d)

คำถามที่พบบ่อย

แบบฝึกหัดเรื่องตารางเชิงเส้น กราฟ และสมการ ครอบคลุมเนื้อหาอะไรบ้าง?

แบบฝึกหัดสำหรับนักเรียนชั้น ม.1 นี้ประกอบด้วยคำถามแบบเลือกตอบ 18 ข้อ เพื่อประเมินว่านักเรียนเชื่อมโยงตาราง กราฟ และสถานการณ์ในชีวิตจริงเข้ากับสมการเชิงเส้นได้อย่างไร นักเรียนจะได้เรียนรู้การระบุอัตราต่อหน่วยและอัตราการเปลี่ยนแปลง จำแนกความสัมพันธ์ว่าเป็นสัดส่วนหรือไม่เป็นสัดส่วน และตีความค่าสัมประสิทธิ์และค่าคงที่ในสมการ เช่น y = 12x + 30

ฉันจะใช้แบบฝึกหัดนี้สอนการเขียนสมการเชิงเส้นจากตารางและกราฟได้อย่างไร?

เริ่มแบบฝึกหัดโดยให้นักเรียนระบุว่าตัวแปรแต่ละตัวแทนอะไร และมองหาอัตราการเปลี่ยนแปลงก่อนที่จะเลือกสมการ สำหรับโจทย์ปัญหาในบริบทต่างๆ เช่น ค่าโดยสารรถแท็กซี่ ค่าจ้าง และเงินออม ให้ขอให้นักเรียนแยกค่าใช้จ่ายต่อหน่วยหรือการเพิ่มขึ้นออกจากค่าธรรมเนียมเริ่มต้นหรือจำนวนเงินเริ่มต้น จากนั้นใช้ตัวเลือกแบบปรนัยเพื่ออธิบายว่าทำไมสมการที่ตรงกันจึงถูกต้อง

ฉันควรสังเกตข้อผิดพลาดอะไรบ้างเมื่อนักเรียนทำแบบฝึกหัดนี้เสร็จ?

นักเรียนอาจเลือกค่าคงที่ให้เป็นอัตราการเปลี่ยนแปลง เช่น การตีความ 100 แทนที่จะเป็น 10 ว่าเป็นการเปลี่ยนแปลงรายสัปดาห์ของ y = 10x + 100 นอกจากนี้ พวกเขาอาจละเว้นค่าธรรมเนียมเริ่มต้นในสถานการณ์ต่างๆ เช่น ค่าเช่าไม้กอล์ฟหรือค่าโดยสารแท็กซี่ สลับตัวแปรในสมการ หรือเรียกตารางว่าเป็นสัดส่วนโดยไม่ตรวจสอบว่าอัตราต่อหน่วยยังคงที่หรือไม่

ฉันจะมอบหมายและให้คะแนนแบบฝึกหัดเรื่องตารางเชิงเส้น กราฟ และสมการนี้ได้อย่างไร?

Wayground จัดเตรียมแบบฝึกหัดนี้ในรูปแบบไฟล์ PDF ที่สามารถพิมพ์ได้ และในรูปแบบแบบทดสอบดิจิทัล โดยมีเฉลยคำตอบครบถ้วนสำหรับตรวจสอบคำตอบแบบเลือกตอบ 18 ข้อ นอกจากนี้ ยังสามารถตรวจงานของนักเรียนได้โดยการสแกนงานของนักเรียนด้วยแอป Wayground for Teachers

ฉันจะปรับแบบฝึกหัดสมการเชิงเส้นนี้ให้เหมาะสมกับนักเรียนของฉันได้อย่างไร?

ในการตั้งค่าขั้นสูงของแบบฝึกหัด ให้ปรับระยะห่างระหว่างตัวอักษรหรือขนาดตัวอักษรเพื่อให้ตัวเลือกสมการ ตาราง และคำถามที่ใช้กราฟอ่านง่ายขึ้น นอกจากนี้ คุณยังสามารถใช้แบบอักษรที่เหมาะสำหรับผู้ที่มีภาวะดิสเล็กเซีย หรือแปลแบบฝึกหัดเป็นภาษาอื่นหากภาษาดังกล่าวรองรับการเข้าถึงคำถามเกี่ยวกับความสัมพันธ์เชิงเส้นได้

ฉันจะหาแบบฝึกหัดแบบนี้เพิ่มเติมได้ที่ไหนบน Wayground?

Wayground นำเสนอชุดแบบฝึกหัดและโจทย์ฝึกหัดฟรีที่ครอบคลุมทุกวิชา พร้อมไฟล์ PDF และเฉลยคำตอบ เพื่อช่วยเสริมสร้างทักษะและความเข้าใจในแนวคิดสำคัญ ดูแหล่งข้อมูลเพิ่มเติมได้ที่ https://wayground.com/en-us/worksheets