

Wayground
the heating curve for water - Printable Science Worksheets ระดับ 11 - Wayground

the heating curve for water

16 คำถาม

11th - 11th ระดับชั้น

Science

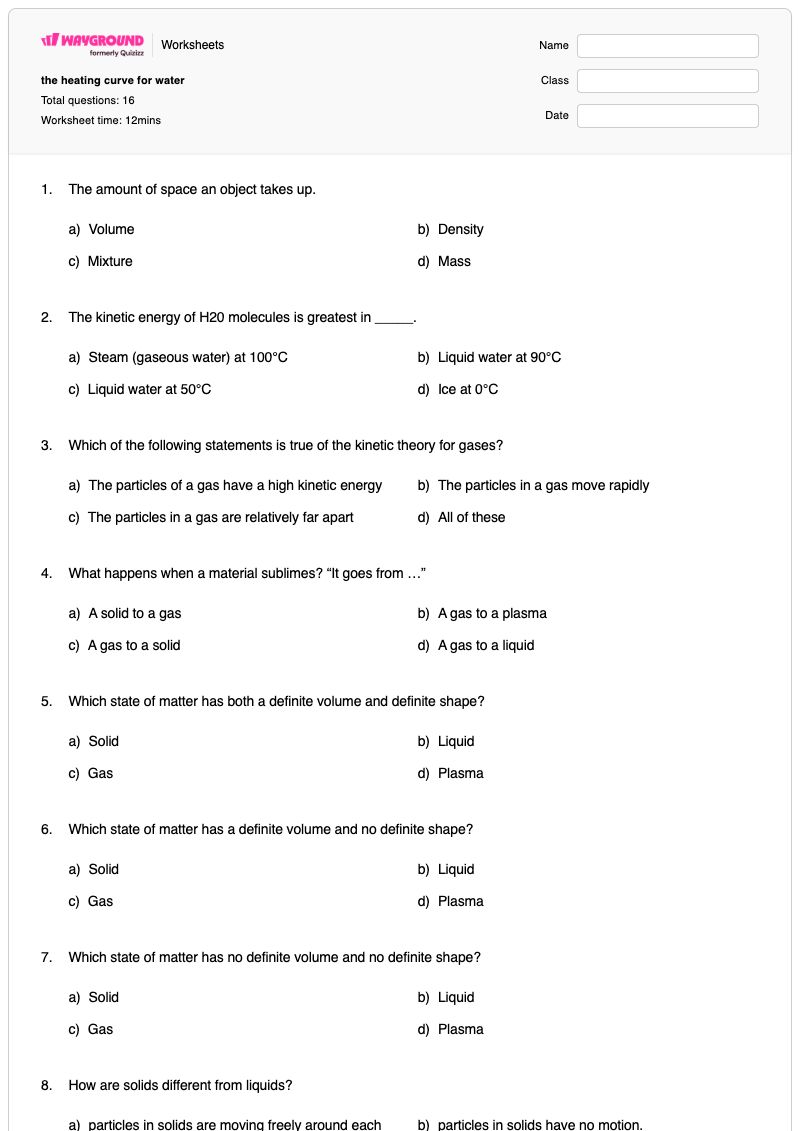
แบบฝึกหัดเรื่องกราฟความร้อนของน้ำ ออกแบบมาสำหรับนักเรียนวิทยาศาสตร์ชั้นมัธยมศึกษาปีที่ 4 ที่เรียนเรื่องการเคลื่อนที่ของอนุภาค สถานะของสสาร การเปลี่ยนแปลงสถานะ และการถ่ายโอนพลังงาน แบบฝึกหัดประกอบด้วย 16 ข้อ—15 ​​ข้อเป็นคำถามแบบเลือกตอบ และ 1 ข้อเป็นคำถามแบบเลือกตอบหลายข้อ—นักเรียนจะได้เรียนรู้เกี่ยวกับคุณสมบัติของของแข็ง ของเหลว และก๊าซ การเชื่อมโยงความเร็วของโมเลกุลกับอุณหภูมิและพลังงานจลน์ การหลอมเหลว การควบแน่น และการระเหิด และการประยุกต์ใช้แนวคิดทฤษฎีจลน์ คำถามหลายข้อต้องการให้นักเรียนตีความกราฟความร้อนโดยแยกแยะส่วนที่มีอุณหภูมิสูงขึ้นจากส่วนที่มีอุณหภูมิคงที่ซึ่งเป็นการเปลี่ยนแปลงสถานะ และระบุช่วงเวลาที่เกี่ยวข้องกับพลังงานจลน์หรือพลังงานศักยภาพ นักเรียนยังต้องประยุกต์ใช้หลักการกำหนดเครื่องหมายสำหรับความร้อนดูดความร้อน และอธิบายการควบแน่นในชีวิตประจำวันโดยใช้พฤติกรรมของอนุภาค แบบฝึกหัดที่พิมพ์ได้ฟรีนี้ให้การฝึกฝนที่เน้นเฉพาะด้านและมีเฉลยคำตอบที่สมบูรณ์เพื่อตรวจสอบความเข้าใจ ทบทวนความเข้าใจผิด หรือสนับสนุนการประเมินผลหลังจากการเรียนการสอนเกี่ยวกับกราฟความร้อนและพฤติกรรมของน้ำ

การตั้งค่าแผ่นงาน

ขนาดตัวอักษร

S
M
L
XL
แผ่นงาน

the heating curve for water

คำถามทั้งหมด: 16

ชื่อ
ระดับ
วันที่
1.

The amount of space an object takes up.

a)

Volume

b)

Density

c)

Mixture

d)

Mass

2.

The kinetic energy of H20 molecules is greatest in _____.

a)

Steam (gaseous water) at 100°C

b)

Liquid water at 90°C

c)

Liquid water at 50°C

d)

Ice at 0°C

3.

Which of the following statements is true of the kinetic theory for gases?

a)

The particles of a gas have a high kinetic energy

b)

The particles in a gas move rapidly

c)

The particles in a gas are relatively far apart

d)

All of these

4.

What happens when a material sublimes? “It goes from …”

a)

A solid to a gas

b)

A gas to a plasma

c)

A gas to a solid

d)

A gas to a liquid

5.

Which state of matter has both a definite volume and definite shape?

a)

Solid

b)

Liquid

c)

Gas

d)

Plasma

6.

Which state of matter has a definite volume and no definite shape?

a)

Solid

b)

Liquid

c)

Gas

d)

Plasma

7.

Which state of matter has no definite volume and no definite shape?

a)

Solid

b)

Liquid

c)

Gas

d)

Plasma

8.
How are solids different from liquids?
a)
particles in solids are moving freely around each other.
b)
particles in solids have no motion.
c)
particles in solids are vibrating in place.
d)
particles in solids have more motion than in liquids
9.

Suppose you pour a glass of ice water and set it on the kitchen table. After a few minutes, the outside of the glass will be covered with drops of water. Why did this happen?

a)

Oxygen in the air cooled and condensed onto the cold glass.

b)

Water vapor in the air cooled and condensed onto the cold glass.

c)

Water vapor in the air cooled and evaporated onto the cold glass.

d)

Water seeped through pores in the glass.

10.
Which set of segments represents periods of potential energy?
a)
1,3,5
b)
2,4
11.
Which set of segments represents periods of kinetic energy?
a)
1,3,5
b)
2,4
12.

Endothermic is expressed as

a)

-q meaning heat in

b)

-q meaning heat out

c)

+q meaning heat in

d)

+ q meaning heat out

13.

Which line segment represents the substance only in the solid state?

a)

AB‾\overline{AB}  

b)

BC‾\overline{BC}  

c)

CD‾\overline{CD}  

d)

DE‾\overline{DE}  

14.

What is occurring between B-->C?

a)

Temperature is rising & phase change is occurring

b)

Temperature is unchanging & phase change is occuring

c)

Temperature is rising with no phase change

d)

Temperature is unchanging & no phase change

15.
What can be determined by measuring the speed of molecules?
a)
volume
b)
density
c)
pressure
d)
temperature
16.

Select all that apply.


In the process of evaporation,

a)

particles at the surface that have enough energy can escape the liquid and enter the gas phase.

b)

some of the molecules in a gas will have lower energy than the rest and can transition to the liquid phase

c)

it happens at the surface of liquids and its one type of vaporization

d)

increasing the temperature of a liquid results in more particles having enough energy to evaporate

แป้นคำตอบ

the heating curve for water

คำถามทั้งหมด: 16

1.
a)

Volume

2.
a)

Steam (gaseous water) at 100°C

3.
d)

All of these

4.
a)

A solid to a gas

5.
a)

Solid

6.
b)

Liquid

7.
c)

Gas

8.
c) particles in solids are vibrating in place.
9.
b)

Water vapor in the air cooled and condensed onto the cold glass.

10.
b) 2,4
11.
a) 1,3,5
12.
c)

+q meaning heat in

13.
a)

AB‾\overline{AB}  

14.
b)

Temperature is unchanging & phase change is occuring

15.
d) temperature
16.
a)

particles at the surface that have enough energy can escape the liquid and enter the gas phase.

, d)

increasing the temperature of a liquid results in more particles having enough energy to evaporate

, c)

it happens at the surface of liquids and its one type of vaporization

คำถามที่พบบ่อย

แบบฝึกหัดกราฟแสดงความสัมพันธ์ระหว่างอุณหภูมิและความร้อนนี้ ช่วยให้นักเรียนชั้นมัธยมศึกษาปีที่ 4 เรียนรู้อะไรบ้าง?

แบบฝึกหัดนี้ช่วยเสริมสร้างความสามารถของนักเรียนในการเชื่อมโยงกราฟการให้ความร้อนของน้ำกับการเคลื่อนที่ของอนุภาค อุณหภูมิ พลังงานจลน์ พลังงานศักย์ และการเปลี่ยนแปลงสถานะ แบบฝึกหัดประกอบด้วยคำถามแบบเลือกตอบ 15 ข้อ และคำถามแบบเลือกตอบหลายข้ออีก 1 ข้อ โดยให้นักเรียนจำแนกสถานะของสสาร ระบุถึงกระบวนการต่างๆ เช่น การระเหิดและการควบแน่น และแยกแยะส่วนที่มีอุณหภูมิสูงขึ้นจากส่วนที่มีอุณหภูมิคงที่ซึ่งแสดงการเปลี่ยนแปลงสถานะ

ฉันจะใช้แบบฝึกหัดนี้สอนเรื่องกราฟแสดงความสัมพันธ์ระหว่างอุณหภูมิของน้ำกับอัตราการเพิ่มอุณหภูมิได้อย่างไร?

หลังจากสาธิตการเปลี่ยนแปลงความเร็ว อุณหภูมิ และพลังงานของอนุภาคขณะที่น้ำเคลื่อนที่ผ่านสถานะของแข็ง ของเหลว และก๊าซแล้ว ให้นำใบงานมาให้นักเรียนทำ จากนั้นให้นักเรียนทำเครื่องหมายบนส่วนต่างๆ ของกราฟก่อนตอบคำถาม โดยระบุว่าช่วงใดแสดงถึงการเปลี่ยนแปลงพลังงานจลน์ และช่วงใดแสดงถึงการเปลี่ยนแปลงพลังงานศักย์ จากนั้นใช้หัวข้อเกี่ยวกับ B→C ความร้อนดูดความร้อน และการควบแน่น เพื่อกระตุ้นให้นักเรียนอธิบายเหตุผลของตนเองโดยใช้หลักฐานในระดับอนุภาค

ฉันควรระวังข้อผิดพลาดอะไรบ้างเมื่อนักเรียนทำแบบฝึกหัดกราฟแสดงความสัมพันธ์ระหว่างอุณหภูมิและความชื้นนี้?

นักเรียนอาจสับสนระหว่างส่วนของกราฟที่มีความชัน ซึ่งอุณหภูมิและพลังงานจลน์เปลี่ยนแปลง กับส่วนของกราฟที่ราบเรียบ ซึ่งเกิดการเปลี่ยนแปลงสถานะในขณะที่อุณหภูมิยังคงไม่เปลี่ยนแปลง นอกจากนี้ พวกเขาอาจสลับป้ายกำกับพลังงานจลน์และพลังงานศักย์บนกราฟความร้อน เข้าใจการระเหิดเป็นการเปลี่ยนแปลงจากของเหลวเป็นแก๊ส หรือเลือกความร้อนที่ออกจากระบบแทนที่จะเป็น +q ซึ่งหมายถึงความร้อนที่เข้าสู่ระบบสำหรับกระบวนการดูดความร้อน ตรวจสอบให้แน่ใจว่านักเรียนแยกแยะความแตกต่างระหว่างการควบแน่นของไอน้ำบนกระจกเย็นกับการระเหย และเชื่อมโยงความเร็วของโมเลกุลกับอุณหภูมิอย่างเฉพาะเจาะจง

ฉันจะมอบหมายและให้คะแนนแบบฝึกหัดกราฟความร้อนนี้ได้อย่างไร?

แบบฝึกหัดนี้มีให้เลือกทั้งแบบไฟล์ PDF ที่สามารถพิมพ์ได้ และแบบทดสอบดิจิทัลบน Wayground คุณจึงสามารถเลือกทำแบบฝึกหัดบนกระดาษหรือทำแบบออนไลน์ก็ได้ แบบฝึกหัดนี้มีเฉลยคำตอบครบถ้วนสำหรับตรวจข้อสอบเรื่องสถานะของสสาร พลังงานของอนุภาค และการตีความกราฟความร้อน สำหรับการส่งงานแบบพิมพ์ ให้สแกนงานของนักเรียนด้วยแอป Wayground for Teachers เพื่อช่วยตรวจคำตอบได้อย่างมีประสิทธิภาพ

ฉันจะปรับแบบฝึกหัดเรื่องกราฟแสดงอุณหภูมิของน้ำนี้ให้เหมาะสมกับนักเรียนของฉันได้อย่างไร?

ใช้การตั้งค่าขั้นสูงของแบบฝึกหัดเพื่อปรับระยะห่างระหว่างตัวอักษรหรือเพิ่มขนาดตัวอักษร เพื่อให้ป้ายกำกับกราฟความร้อนและตัวเลือกคำตอบอ่านง่ายขึ้น นอกจากนี้ คุณยังสามารถใช้แบบอักษรที่เหมาะสำหรับผู้ที่มีภาวะดิสเล็กเซีย หรือแปลแบบฝึกหัดเป็นภาษาอื่น เพื่อสนับสนุนการเข้าถึงคำถามเกี่ยวกับการเคลื่อนที่ของอนุภาคและการเปลี่ยนแปลงสถานะโดยไม่ต้องเปลี่ยนแปลงเนื้อหา

ฉันจะหาแบบฝึกหัดแบบนี้เพิ่มเติมได้ที่ไหนบน Wayground?

Wayground มีแบบฝึกหัดและโจทย์ฝึกหัดมากมายให้ดาวน์โหลดฟรีในหลากหลายวิชา พร้อมไฟล์ PDF และเฉลยคำตอบ เพื่อช่วยให้นักเรียนพัฒนาทักษะและความเข้าใจในแนวคิดสำคัญๆ ดูแหล่งข้อมูลเพิ่มเติมได้ที่ https://wayground.com/en-us/worksheets