

Wayground
heating curve - Printable Chemistry Worksheets - Wayground

heating curve

25 คำถาม

11th - 11th ระดับชั้น

Chemistry

แบบฝึกหัดวิชาเคมี ม.11 ฉบับพิมพ์ฟรีนี้ ช่วยให้นักเรียนตีความกราฟการร้อนและการเย็นตัว และเชื่อมโยงส่วนต่างๆ ของกราฟกับการเปลี่ยนแปลงของสสาร แบบฝึกหัดประกอบด้วยคำถามแบบเลือกตอบ 25 ข้อ นักเรียนจะได้ระบุบริเวณของของแข็ง ของเหลว และก๊าซ หาจุดหลอมเหลวและจุดเดือด รู้จักช่วงอุณหภูมิคงที่ ระบุว่ามีสถานะเดียวหรือสองสถานะ และแยกแยะกระบวนการต่างๆ เช่น การระเหย การควบแน่น และการแข็งตัว นอกจากนี้ยังมีหลายข้อที่เชื่อมโยงการเปลี่ยนแปลงสถานะกับพลังงานจลน์ และระบุพลังงานที่ปล่อยออกมาในระหว่างกระบวนการคายความร้อน แบบฝึกหัดนี้ออกแบบมาเพื่อการสอน การฝึกฝนแบบมีผู้แนะนำ หรือการตรวจสอบความเข้าใจอย่างรวดเร็วหลังจากที่นักเรียนได้เรียนรู้วิธีการอ่านกราฟอุณหภูมิเทียบกับเวลาแล้ว นักเรียนต้องใช้ป้ายกำกับกราฟและพฤติกรรมของช่วงอุณหภูมิคงที่เพื่อเลือกคำตอบที่ถูกต้อง แทนที่จะพึ่งพาเฉพาะคำศัพท์เกี่ยวกับการเปลี่ยนแปลงสถานะเท่านั้น แบบฝึกหัดนี้มีเฉลยคำตอบครบถ้วน ทำให้การทบทวนและการให้ข้อเสนอแนะมีประสิทธิภาพ ครูสามารถใช้แบบฝึกหัดฉบับพิมพ์ฟรีนี้สำหรับการทำงานอิสระ การอภิปรายกับเพื่อน หรือการประเมินผลในหน่วยวิชาเคมี ม.11 เกี่ยวกับกราฟการร้อนและการเปลี่ยนแปลงสถานะ

การตั้งค่าแผ่นงาน

ขนาดตัวอักษร

S
M
L
XL
แผ่นงาน

heating curve

คำถามทั้งหมด: 25

ชื่อ
ระดับ
วันที่
1.
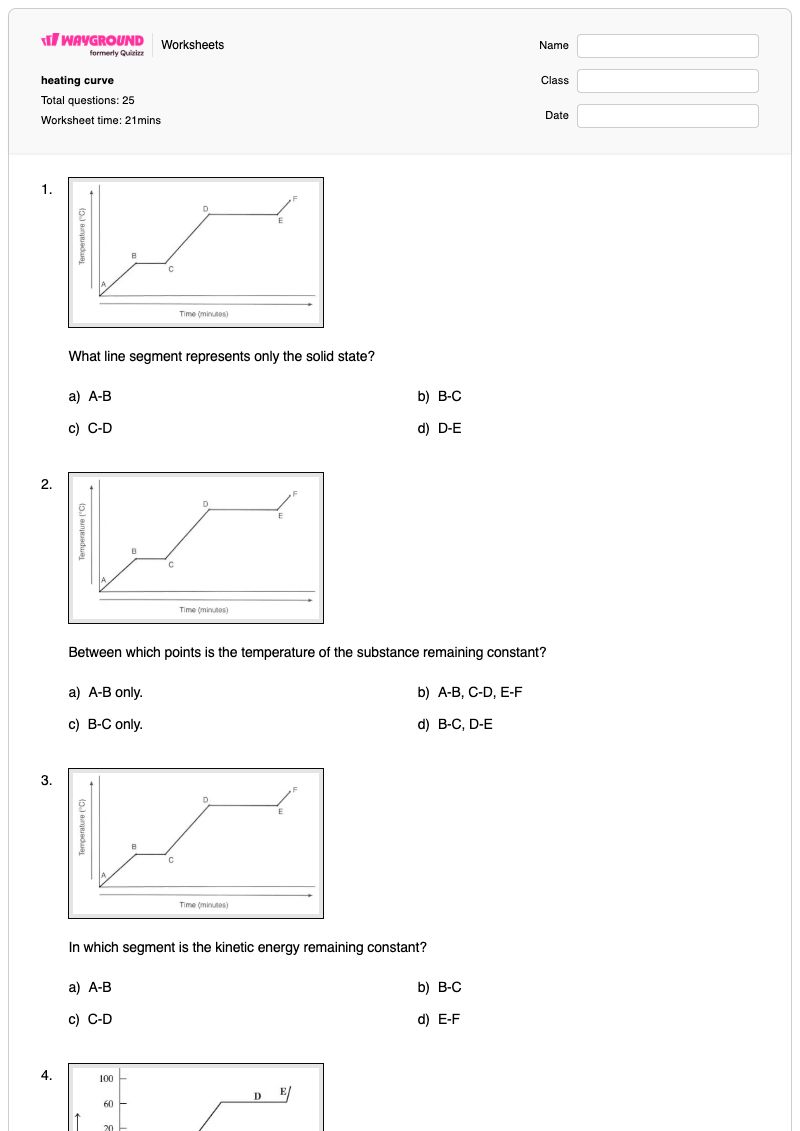
What line segment represents only the solid state?
a)
A-B
b)
B-C
c)
C-D
d)
D-E
2.
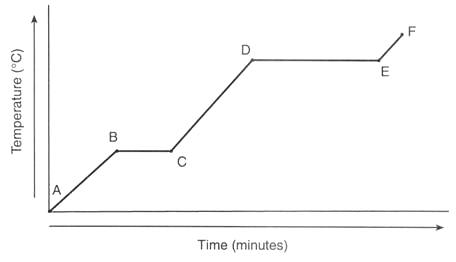
Between which points is the temperature of the substance remaining constant?
a)
A-B only. 
b)
A-B, C-D, E-F
c)
B-C only. 
d)
B-C, D-E
3.
In which segment is the kinetic energy remaining constant?
a)
A-B
b)
B-C
c)
C-D
d)
E-F
4.
A substance's heating curve is shown in the graph.  What is its boiling point?
a)
100 C
b)
60 C
c)
80 C
d)
20 C
5.
The graph shows a cooling curve for an unknown substance.  What is happening during segment DE?
a)
boiling
b)
condensation
c)
freezing
d)
melting
6.
A substance's heating curve is shown in the graph.  What is its boiling point?
a)
100 C
b)
60 C
c)
80 C
d)
20 C
7.
Which of these conditions is always true for an exothermic process?
a)
They leave the surroundings feeling cold
b)
They release energy into the surroundings.
c)
They absorb energy from the surroundings
d)
The reactants gain energy as they form the products
8.
Which of the following terms identifies the change from a liquid to gas?
a)
Vaporization
b)
Condensation
c)
Deposition
d)
Sublimation
9.

The melting point of the sample is

a)

-60 ºC

b)

-100 ºC

c)

60 ºC

d)

100 ºC

10.

In which region(s) of the graph would the substance be melting?

a)

No melting occurs on this graph

b)

Region C-E

c)

Region E-G

d)

Region G-I

11.
Describe the substance between letters D and E. 
a)
Gas
b)
Liquid
c)
Melting
d)
Evaporating
12.
Between which points is the temperature of the substance remaining constant?
a)
A-B only. 
b)
A-B, C-D, E-F
c)
B-C only. 
d)
B-C, D-E
13.
What state(s) of matter are present at D-E?
a)
Solid-liquid
b)
Liquid
c)
Liquid-gas
d)
Gas-Solid
14.
Describe the substance between letters E and F. 
a)
Gas
b)
Liquid
c)
Melting
d)
Evaporating
15.
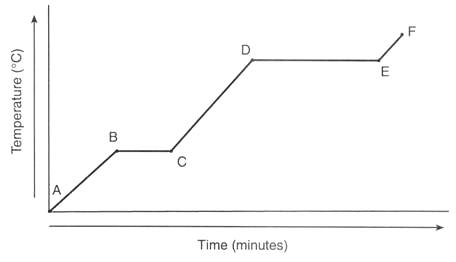
How many states of matter are present during line segment BC?
a)
One
b)
Two
c)
Three
d)
Depends on the temperature
16.
What is water's freezing point?
a)
0 F
b)
32 C
c)
50 C
d)
0 C
17.
My particles move the slowest.
a)
Solid
b)
liquid
c)
Gas
d)
Plasma
18.
I have a definite volume, but no definite shape
a)
Gas
b)
Liquid
c)
Plasma
d)
Solid
19.
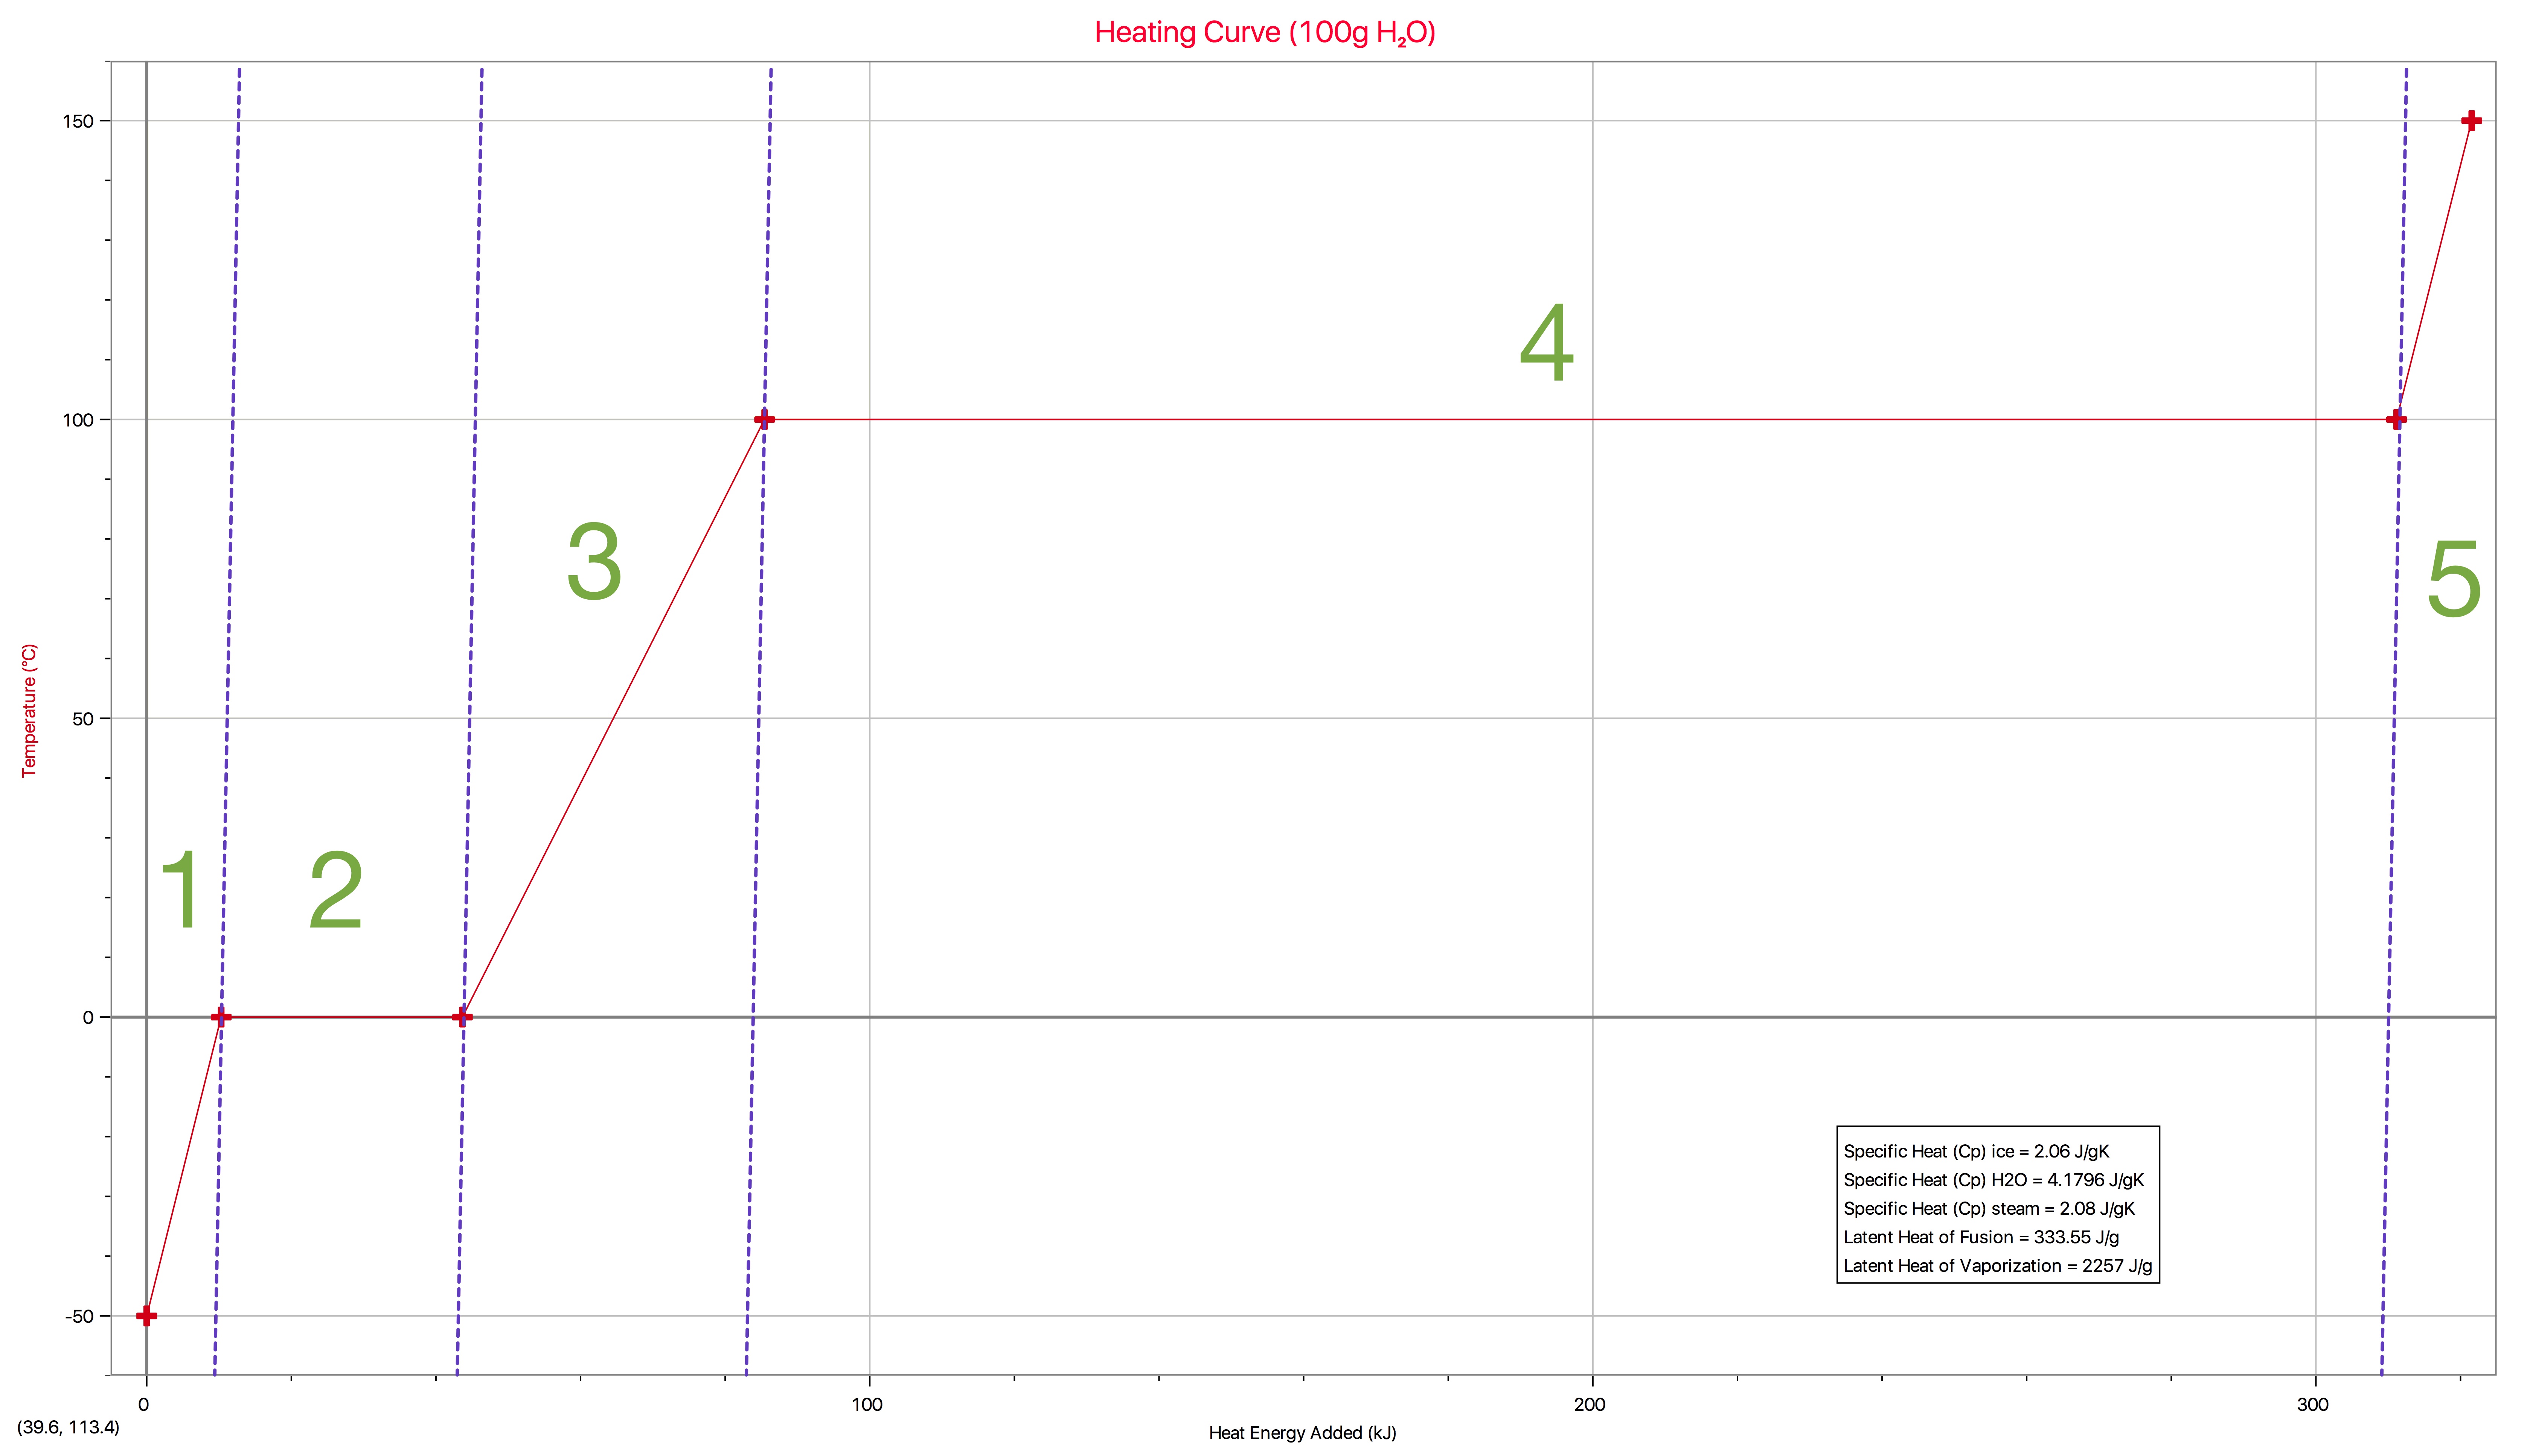
In which region(s) does temperature increase?
a)
Region 1, 3, & 5
b)
Region 2 & 4
c)
Region 1 only
d)
Region 1 & 2
20.
In which region(s) of the graph would the substance only be in one phase?
a)
Region 1, 3, & 5
b)
Region 2 & 4
c)
Region 1 only
d)
Region 1 & 2
21.
Decreasing the temperature of something is called ______.
a)
heating
b)
cooling
c)
non-reversible change
d)
reversible change
22.

The melting point of the sample is

a)

-60 ºC

b)

-100 ºC

c)

60 ºC

d)

100 ºC

23.

Given the heating curve of a solid being heated at a constant rate, what is the boiling point of this substance?

a)

20°C

b)

50°C

c)

110°C

d)

170°C

24.

Given the heating curve of a solid being heated at a constant rate, how much total time was required to boil this substance after it reached its melting point?

a)

3 minutes

b)

4 minutes

c)

10 minutes

d)

14 minutes

25.
True or false: melting and freezing occur at the same temperature!
a)
True
b)
False
c)
I don't know
แป้นคำตอบ

heating curve

คำถามทั้งหมด: 25

1.
a) A-B
2.
d) B-C, D-E
3.
b) B-C
4.
b) 60 C
5.
c) freezing
6.
b) 60 C
7.
b) They release energy into the surroundings.
8.
a) Vaporization
9.
a)

-60 ºC

10.
a)

No melting occurs on this graph

11.
d) Evaporating
12.
d) B-C, D-E
13.
c) Liquid-gas
14.
a) Gas
15.
b) Two
16.
d) 0 C
17.
a) Solid
18.
b) Liquid
19.
a) Region 1, 3, & 5
20.
a) Region 1, 3, & 5
21.
b) cooling
22.
a)

-60 ºC

23.
c)

110°C

24.
b)

4 minutes

25.
a) True

คำถามที่พบบ่อย

แบบฝึกหัดกราฟแสดงความสัมพันธ์ระหว่างอุณหภูมิและความร้อนนี้ครอบคลุมหัวข้ออะไรบ้าง?

แบบฝึกหัดวิชาเคมี ม.4 ชุดนี้ ประกอบด้วยคำถามแบบเลือกตอบ 25 ข้อ เพื่อประเมินความเข้าใจของนักเรียนเกี่ยวกับการตีความส่วนต่างๆ ของกราฟการร้อนและการเย็นตัว นักเรียนจะต้องระบุสถานะที่เกิดขึ้น หาจุดหลอมเหลวและจุดเดือด จดจำช่วงอุณหภูมิคงที่ เชื่อมโยงช่วงอุณหภูมิคงที่กับพลังงานจลน์คงที่ และตั้งชื่อการเปลี่ยนแปลงสถานะ เช่น การระเหย การควบแน่น และการแข็งตัว

ฉันจะใช้แบบฝึกหัดนี้สอนนักเรียนเกี่ยวกับการอ่านกราฟแสดงการเปลี่ยนแปลงอุณหภูมิได้อย่างไร?

เริ่มต้นด้วยการแนะนำกราฟโดยให้นักเรียนแยกแยะส่วนที่เพิ่มขึ้นจากส่วนที่เป็นเส้นตรงราบเรียบ จากนั้นอภิปรายว่าส่วนที่เป็นเส้นตรงราบเรียบแสดงถึงการเปลี่ยนแปลงสถานะในขณะที่อุณหภูมิคงที่ ใช้คำถามตามส่วนต่างๆ ในแบบฝึกหัดเพื่อกระตุ้นให้นักเรียนอธิบายว่าทำไม B-C หรือ D-E จึงสามารถมีสถานะได้สองสถานะ และขอให้นักเรียนให้เหตุผลเกี่ยวกับคำตอบว่าสารนั้นเป็นของแข็ง ของเหลว ก๊าซ กำลังหลอมเหลว หรือกำลังระเหย

ฉันควรระวังข้อผิดพลาดอะไรบ้างเมื่อนักเรียนทำแบบฝึกหัดกราฟแสดงความสัมพันธ์ระหว่างอุณหภูมิและความชื้นนี้?

นักเรียนอาจสับสนระหว่างช่วงอุณหภูมิคงที่กับการไม่มีการเปลี่ยนแปลงพลังงาน แม้ว่าแบบฝึกหัดจะขอให้พวกเขาระบุพลังงานจลน์คงที่ระหว่างการเปลี่ยนแปลงสถานะก็ตาม นอกจากนี้ พวกเขาอาจเลือกคำศัพท์เกี่ยวกับการเปลี่ยนแปลงสถานะโดยไม่ตรวจสอบทิศทางการเปลี่ยนแปลง เช่น เลือกการหลอมเหลวแทนการแข็งตัว หรืออ่านจุดเดือดหรือจุดหลอมเหลวจากช่วงอุณหภูมิที่เพิ่มขึ้นแทนที่จะอ่านจากช่วงอุณหภูมิคงที่ที่เกี่ยวข้อง

ฉันจะมอบหมายและให้คะแนนแบบฝึกหัดกราฟความร้อนนี้ได้อย่างไร?

แบบฝึกหัดนี้มีให้ดาวน์โหลดในรูปแบบ PDF ที่สามารถพิมพ์ได้ และเป็นแบบทดสอบดิจิทัลบน Wayground โดยมีเฉลยคำตอบครบถ้วนสำหรับคำถามแบบเลือกตอบ 25 ข้อ สำหรับการส่งงานแบบพิมพ์ คุณสามารถสแกนงานของนักเรียนด้วยแอป Wayground for Teachers เพื่อให้การตรวจงานง่ายขึ้น รูปแบบที่พิมพ์ได้ยังช่วยสนับสนุนชั้นเรียนหรือโรงเรียนที่ต้องการลดเวลาการใช้หน้าจอได้อีกด้วย

ฉันจะปรับแบบฝึกหัดเรื่องกราฟความร้อนนี้ให้เหมาะสมกับนักเรียนของฉันได้อย่างไร?

ในส่วนการตั้งค่าขั้นสูงของแบบฝึกหัด ให้ปรับระยะห่างระหว่างตัวอักษรและขนาดตัวอักษรเพื่อให้คำถามแบบเลือกตอบและป้ายกำกับกราฟอ่านง่ายขึ้น นอกจากนี้ คุณยังสามารถใช้แบบอักษรที่เหมาะสำหรับผู้ที่มีภาวะดิสเล็กเซีย หรือแปลแบบฝึกหัดเป็นภาษาอื่นได้ โดยคงคำถามและตัวเลือกคำตอบเกี่ยวกับช่วงเส้นโค้งความร้อนไว้เหมือนเดิม

ฉันจะหาแบบฝึกหัดแบบนี้เพิ่มเติมได้ที่ไหนบน Wayground?

Wayground นำเสนอชุดแบบฝึกหัดและโจทย์ฝึกหัดฟรีที่ครอบคลุมหลากหลายวิชา พร้อมไฟล์ PDF และเฉลยคำตอบ เพื่อช่วยให้นักเรียนพัฒนาทักษะและความเข้าใจในแนวคิดที่สำคัญ ดูแหล่งข้อมูลเพิ่มเติมได้ที่ https://wayground.com/en-us/worksheets