
 แผ่นงาน
Heating Curves
คำถามทั้งหมด: 15
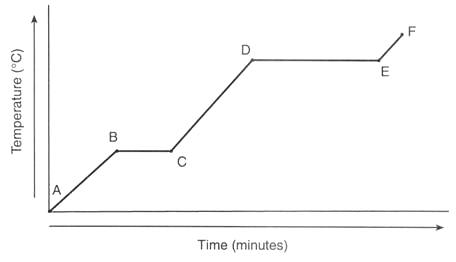

The melting point of the sample is
-60 ºC
-100 ºC
60 ºC
100 ºC

Given the heating curve of a solid being heated at a constant rate, what is the boiling point of this substance?
20°C
50°C
110°C
170°C


NaCl was heated starting at an initial temperature of 0°C. The heating curve is shown in the picture. What is the melting point of this substance?
0°C
801°C
1000°C
1465°C

In which region(s) does temperature increase?
Region C only
Regions B and D
Regions A, C, and E
Regions A and B
In a heating curve, diagonal lines indicate temperature is __________, while flat lines indicate temperature is __________.
Constant, changing
Changing, constant

Given the heating curve of a solid being heated at a constant rate, how much total time was required to boil this substance after it reached its melting point?
3 minutes
4 minutes
10 minutes
14 minutes

NaCl(s) was heated up starting at an initial temperature of 0°C. The heating curve is shown in the picture.During which segments of the diagram is potential energy increasing? (Check all that apply)
AB
BC
CD
DE

Given the heating curve of water, what is happening to potential and kinetic energy during segment CD?
the potential energy and kinetic energy both increase
the potential energy increases while the kinetic energy decreases
the potential energy is constant while the kinetic energy increases
the potential energy increases while the kinetic energy is constant

Given the heating curve for water, during which line segment could I find water in both the solid and liquid phase at the same time?
AB
BC
CD
DE
EF
แป้นคำตอบHeating Curves
คำถามทั้งหมด: 15
-60 ºC
110°C
801°C
Regions A, C, and E
Changing, constant
4 minutes
BC
, d)DE
the potential energy is constant while the kinetic energy increases
BC