

Wayground
Interpreting Graphs of Proportional Relationships - Printable Mathematics Worksheets ระดับ 7 - Wayground

Interpreting Graphs of Proportional Relationships

10 คำถาม

7th - 7th ระดับชั้น

Mathematics

แบบฝึกหัดคณิตศาสตร์สำหรับนักเรียนชั้น ม.1 เรื่องการตีความกราฟความสัมพันธ์แบบสัดส่วน ช่วยให้นักเรียนรู้จักและอธิบายความสัมพันธ์แบบสัดส่วนในกราฟในชีวิตจริง แบบฝึกหัดนี้ประกอบด้วย 10 ข้อ นักเรียนจะได้วิเคราะห์ราคาน้ำมัน ระยะทางที่ขับรถในช่วงเวลาต่างๆ และราคาคุกกี้ เพื่อพิจารณาว่าข้อมูลเป็นสัดส่วนกันหรือไม่ ระบุเส้นตรงที่ผ่านจุดกำเนิด และตีความคู่ลำดับ เช่น (10, 30), (5, 250) และ (1, 0.50) ในบริบทต่างๆ แบบฝึกหัดนี้ประกอบด้วยคำถามแบบเลือกตอบ 5 ข้อ และคำถามแบบลากและวาง การเลือกจุดสำคัญ การเลือกแบบดรอปดาวน์ การคำนวณทางคณิตศาสตร์ และการเลือกหลายรายการ นักเรียนจะได้ระบุอัตราต่อหน่วยบนกราฟ อธิบายว่าจุดกำเนิดแทนอะไร คำนวณอัตราต่อหน่วย และเชื่อมโยงกราฟสัดส่วนกับสมการ y = kx และจุด (1, r) แบบฝึกหัดที่พิมพ์ได้ฟรีนี้มีเฉลยคำตอบครบถ้วน และเหมาะสำหรับการฝึกฝนแบบมีผู้แนะนำ การทำงานอิสระ หรือการประเมินทักษะการตีความกราฟแบบสั้นๆ

การตั้งค่าแผ่นงาน

ขนาดตัวอักษร

S
M
L
XL
แผ่นงาน

Interpreting Graphs of Proportional Relationships

คำถามทั้งหมด: 10

ชื่อ
ระดับ
วันที่
1.

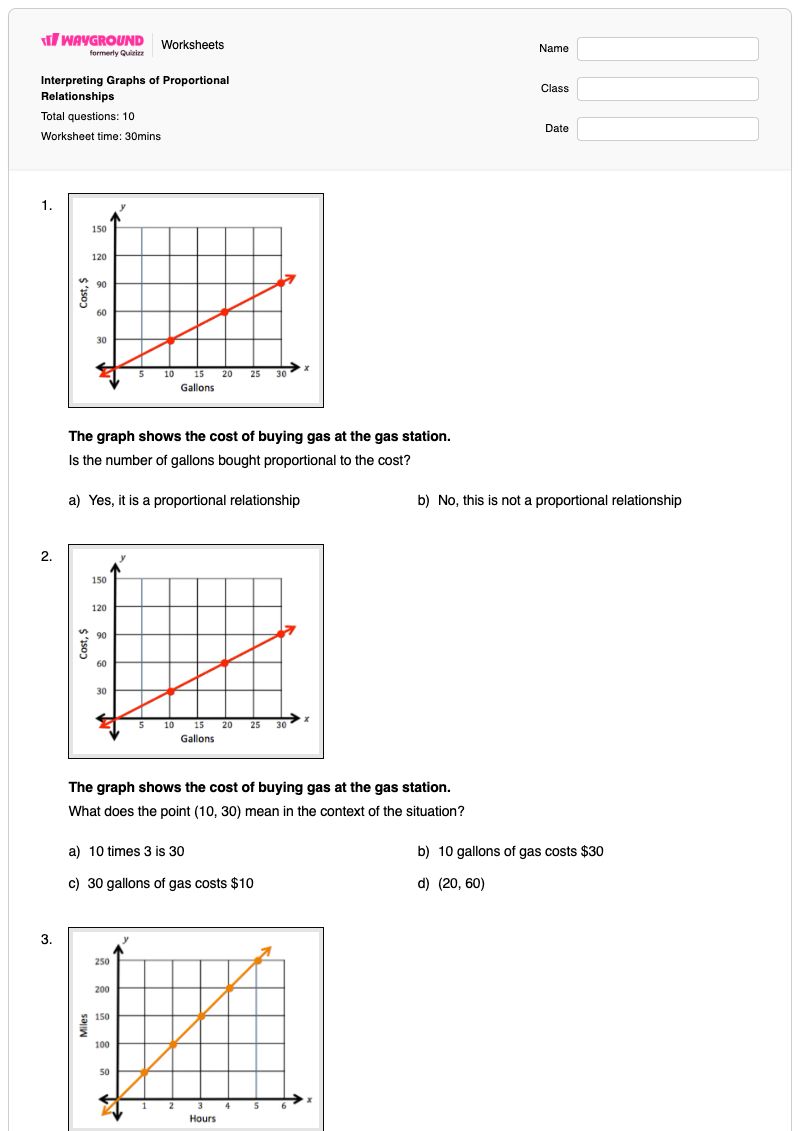
The graph shows the cost of buying gas at the gas station.

Is the number of gallons bought proportional to the cost?

a)

Yes, it is a proportional relationship

b)

No, this is not a proportional relationship

2.

The graph shows the cost of buying gas at the gas station.

What does the point (10, 30) mean in the context of the situation?

a)

10 times 3 is 30

b)

10 gallons of gas costs $30

c)

30 gallons of gas costs $10

d)

(20, 60)

3.

The graph shows the number of miles a car has driven over time.

Is the number of miles driven proportional to the amount of time? How do you know?

​ (a)   , I know this because there ​ (b)   and ​ (c)  

เลือกจากคำด้านล่าง
Yes
is a straight line
it goes through the origin.
No
is a vertical line
it goes on the graph.
4.

The graph shows the number of miles a car has driven over time.

What does the point (5, 250) mean in the context of the situation?

a)

To drive 5 miles it takes 250 hours.

b)

In 5 hours a car can drive 250 miles.

c)

The top of the graph.

5.

The graph shows the number of miles a car has driven over time.

What does the point (1, 50) mean in the context of the situation?

a)

For every hour the car can travel 50 miles.

b)

For every mile the car can travel for 50 miles.

c)

The start of the graph.

6.

The graph shows the number of miles a car has driven over time.

Identify the point on the graph that shows the unit rate.

7.

The graph displays the cost to buy cookies at a local bakery.

What does the point (0, 0) mean in the context of the situation?

a)

When 0 cookies are purchased $0 are spent

b)

The beginning of the graph

8.

The graph displays the cost to buy cookies at a local bakery.

What does the point (1, 0.50) mean in the context of the situation?

You purchased ​ (a)   ​ cookie it cost ​ (b)   ​

เลือกจากคำด้านล่าง
$0.50
1
$1.00
9.

The graph displays the cost to buy cookies at a local bakery.

What is the unit rate for the cost of cookies?

10.

Select all that apply:

If two sets of data are proportional to one another:

a)

the value of every ratio y/x will not be equal

b)

the graph that represents the data will be a straight line that passes through the origin.

c)

the graph will contain the points (0, 0) and (1, r) where r is the unit rate.

d)

there will exist a constant, k, for which you can replace in the equation y = kx

แป้นคำตอบ

Interpreting Graphs of Proportional Relationships

คำถามทั้งหมด: 10

1.
a)

Yes, it is a proportional relationship

2.
b)

10 gallons of gas costs $30

3.
Yes, is a straight line, it goes through the origin.
4.
b)

In 5 hours a car can drive 250 miles.

5.
a)

For every hour the car can travel 50 miles.

6.
7.
a)

When 0 cookies are purchased $0 are spent

8.
1, $0.50
9.

.5.5

10.
b)

the graph that represents the data will be a straight line that passes through the origin.

, c)

the graph will contain the points (0, 0) and (1, r) where r is the unit rate.

, d)

there will exist a constant, k, for which you can replace in the equation y = kx

คำถามที่พบบ่อย

แบบฝึกหัดนี้ครอบคลุมหัวข้ออะไรบ้าง?

แบบฝึกหัดสำหรับนักเรียนชั้น ม.1 นี้ เน้นการตีความกราฟแสดงความสัมพันธ์แบบสัดส่วนผ่านคำถามแบบผสม 10 ข้อ นักเรียนจะต้องตัดสินใจว่ากราฟแสดงข้อมูลแบบสัดส่วนหรือไม่ อธิบายความหมายของคู่ลำดับในบริบทของน้ำมัน การขับรถ และราคาคุกกี้ ระบุจุดอัตราต่อหน่วย และเชื่อมโยงกราฟแบบสัดส่วนกับสมการ y = kx

ฉันจะใช้แบบฝึกหัดนี้ในการสอนการตีความกราฟสัดส่วนได้อย่างไร?

เริ่มแบบฝึกหัดโดยทบทวนว่ากราฟสัดส่วนเป็นเส้นตรงที่ผ่านจุดกำเนิด จากนั้นสาธิตวิธีการอ่านคู่ลำดับเป็นข้อความอินพุต-เอาต์พุต เช่น แกลลอนและต้นทุน หรือชั่วโมงและไมล์ ให้นักเรียนทำแบบฝึกหัดระบุกราฟก่อน อภิปรายว่าทำไม (0, 0) จึงมีความสำคัญ จากนั้นใช้จุดฮอตสปอต อัตราต่อหน่วย เมนูแบบดรอปดาวน์ และแบบฝึกหัดคณิตศาสตร์เพื่อเชื่อมโยงจุด (1, r) กับค่าคงที่ของสัดส่วน

ฉันควรสังเกตข้อผิดพลาดอะไรบ้างเมื่อนักเรียนทำแบบฝึกหัดนี้เสร็จ?

ระวังนักเรียนที่สลับพิกัดในประโยค เช่น (5, 250) สับสนระหว่างค่าป้อนเข้าและค่าส่งออก หรือถือว่าเส้นตรงใดๆ เป็นสัดส่วนโดยไม่ตรวจสอบว่าเส้นตรงนั้นผ่านจุดกำเนิดหรือไม่ นักเรียนอาจระบุจุดอัตราต่อหน่วยผิดพลาด ตีความ (0, 0) ว่าเป็นเพียงจุดเริ่มต้นของกราฟแทนที่จะเป็นต้นทุนเป็นศูนย์สำหรับคุกกี้ศูนย์ชิ้น หรือเลือกประโยคแสดงสัดส่วนที่ไม่ถูกต้องในข้อสอบแบบเลือกหลายข้อ

ฉันจะมอบหมายและให้คะแนนแบบฝึกหัดนี้อย่างไร?

แบบฝึกหัดนี้มีให้ดาวน์โหลดในรูปแบบ PDF สำหรับพิมพ์ และเป็นแบบทดสอบดิจิทัลบน Wayground พร้อมเฉลยคำตอบครบถ้วนสำหรับตรวจสอบคำตอบ การส่งงานในรูปแบบ PDF สามารถตรวจได้โดยการสแกนงานของนักเรียนด้วยแอป Wayground for Teachers ในขณะที่เวอร์ชันดิจิทัลรองรับการทำและตรวจงานออนไลน์

ฉันจะปรับแบบฝึกหัดนี้ให้เหมาะสมกับนักเรียนของฉันได้อย่างไร?

ใช้การตั้งค่าขั้นสูงของแบบฝึกหัดเพื่อปรับระยะห่างระหว่างตัวอักษรหรือเพิ่มขนาดตัวอักษร เพื่อให้คำแนะนำในการตีความกราฟและตัวเลือกคำตอบอ่านง่ายขึ้น นอกจากนี้ คุณยังสามารถเปิดใช้งานแบบอักษรที่เหมาะสำหรับผู้ที่มีภาวะดิสเล็กเซีย หรือแปลแบบฝึกหัดเป็นภาษาอื่นเพื่อสนับสนุนการเข้าถึงคำถามเกี่ยวกับกราฟน้ำมัน การขับรถ และคุกกี้ได้อีกด้วย

ฉันจะหาแบบฝึกหัดแบบนี้เพิ่มเติมได้ที่ไหนบน Wayground?

Wayground มีแบบฝึกหัดและโจทย์ฝึกหัดมากมายให้ดาวน์โหลดฟรีในหลากหลายวิชา พร้อมไฟล์ PDF และเฉลยคำตอบ เพื่อช่วยให้นักเรียนพัฒนาทักษะและความเข้าใจในแนวคิดที่สำคัญ ดูแหล่งข้อมูลเพิ่มเติมได้ที่ https://wayground.com/en-us/worksheets