

Wayground
Normal Distribution - Printable Mathematics Worksheets ระดับ 11 - Wayground

Normal Distribution

20 คำถาม

11th - 11th ระดับชั้น

Mathematics

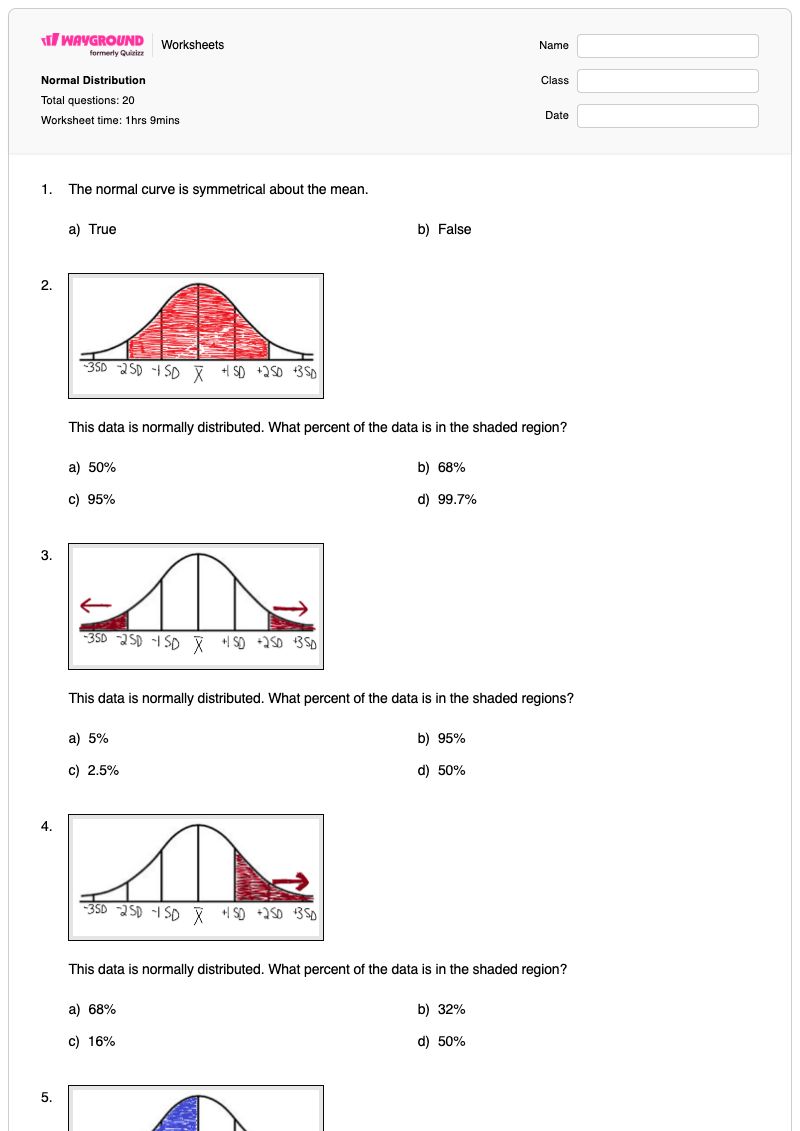
แบบฝึกหัดคณิตศาสตร์ระดับชั้นมัธยมศึกษาปีที่ 4 (เกรด 11) เรื่องการแจกแจงปกติ เป็นแบบฝึกหัดที่พิมพ์ได้ฟรี ช่วยเสริมสร้างความเข้าใจของนักเรียนเกี่ยวกับเส้นโค้งปกติผ่านคำถามแบบเลือกตอบ 20 ข้อ นักเรียนจะได้ระบุความสมมาตรเกี่ยวกับค่าเฉลี่ย ตีความพื้นที่แรเงา ใช้กฎ 68–95–99.7 หาพื้นที่ทั้งหมดใต้เส้นโค้งปกติมาตรฐาน และเชื่อมโยงค่าเบี่ยงเบนมาตรฐานกับเปอร์เซ็นต์และเปอร์เซ็นไทล์ นอกจากนี้ คำถามยังถามให้นักเรียนอ่านป้ายกำกับค่าเฉลี่ยและค่าเบี่ยงเบนมาตรฐานบนกราฟการแจกแจงปกติ ระบุมาตรวัดทางสถิติ และหาเปอร์เซ็นต์ของคะแนนที่สูงกว่าค่าที่กำหนด การผสมผสานระหว่างการตีความแผนภาพและการฝึกฝนแบบเลือกตอบเชิงแนวคิดนี้ช่วยให้นักเรียนแยกแยะค่าเฉลี่ยจากค่าเบี่ยงเบนมาตรฐานและให้เหตุผลเกี่ยวกับตำแหน่งภายในของการแจกแจง แบบฝึกหัดนี้เหมาะสำหรับการฝึกฝนแบบมีผู้แนะนำ การทบทวนด้วยตนเอง หรือการตรวจสอบระหว่างเรียนในบทเรียนสถิติระดับชั้นมัธยมศึกษาปีที่ 4 มีให้ดาวน์โหลดเป็นแบบฝึกหัดที่พิมพ์ได้ฟรีพร้อมเฉลยคำตอบครบถ้วนเพื่อการตรวจสอบที่มีประสิทธิภาพ

การตั้งค่าแผ่นงาน

ขนาดตัวอักษร

S
M
L
XL
แผ่นงาน

Normal Distribution

คำถามทั้งหมด: 20

ชื่อ
ระดับ
วันที่
1.
The normal curve is symmetrical about the mean.
a)
True
b)
False
2.

This data is normally distributed. What percent of the data is in the shaded region?

a)

50%

b)

68%

c)

95%

d)

99.7%

3.

This data is normally distributed. What percent of the data is in the shaded regions?

a)

5%

b)

95%

c)

2.5%

d)

50%

4.

This data is normally distributed. What percent of the data is in the shaded region?

a)

68%

b)

32%

c)

16%

d)

50%

5.
This data is normally distributed.  What percent of the data is in the shaded region?
a)
68%
b)
95%
c)
99.7%
d)
50%
6.

If I tell you that you scored at the 55th percentile on your final exam, you would know:

a)

55% of the class scored the same or worse than you did

b)

You earned a 55% on the exam

c)

You failed the exam

d)

45% of the class scored worse than you did

7.

What percentage of data falls within 1 standard deviation? 

a)

25%

b)

68%

c)

95%

d)

99.7%

8.

How much of the data falls within 3 standard deviations? 

a)

25%

b)

68%

c)

95%

d)

99.7%

9.
What is the the total area under the standard normal distribution curve?
a)
100
b)
25
c)
.5
d)
1
10.
1.  Which best describes the shaded part of this normal distribution graph?  
a)
All data that is one or higher.
b)
All data that is one or more standard deviations above the mean.
c)
All data that is between 1 and 3.
d)
All data that is above the mean.
11.

If this is the graph of data normally distributed with a mean of 30 and a standard deviation of 5, what label (number) is written at the blue circle?

a)

40

b)

35

c)

45

d)

50

12.

If this is the graph of data normally distributed with a mean of 30 and a standard deviation of 5, what label (number) is written at the blue circle?

a)

20

b)

15

c)

40

d)

30

13.

35 is

a)

mean

b)

variance

c)

standard deviation

d)

range

14.

What's the standard deviation?

a)

150

b)

60

c)

240

d)

30

15.

Given a mean of 75 and a standard deviation of 7, what percentage of scores are above 82?

a)

34%

b)

16%

c)

81.5%

d)

2.5%

16.

Given a mean of 75 and a standard deviation of 7, what percentage of scores are between 54 and 96?

a)

13.5%

b)

99.7%

c)

95%

d)

2.15%

17.

If the average annual precipitation in Phoenix is 29 with a standard deviation of 3, what is the "normal" range of precipitation (68%)?

a)

26-32

b)

3-29

c)

26-29

d)

39-32

18.

The ages of golfers are normally distributed, with a mean of 38 and a standard deviation of 4.

Find the percentage of golfers that are between 30 and 46 years old.

a)

68%

b)

94%

c)

95%

d)

99.7%

19.
The shelf life of a particular dairy product is normally distributed with a mean of 12 days and a standard deviation of 3 days.

About what percent of the products last between 12 and 15 days?
a)
68%
b)
34%
c)
16%
d)
2.5%
20.

A line up for tickets to a local concert had an average (mean) waiting time of 20 minutes with a standard deviation of 4 minutes. If 2000 ticket buyers were in line, how many of them would expect to wait for less than 16 minutes?

a)

1750

b)

30

c)

320

d)

100

แป้นคำตอบ

Normal Distribution

คำถามทั้งหมด: 20

1.
a) True
2.
c)

95%

3.
a)

5%

4.
c)

16%

5.
d) 50%
6.
a)

55% of the class scored the same or worse than you did

7.
b)

68%

8.
d)

99.7%

9.
d) 1
10.
b) All data that is one or more standard deviations above the mean.
11.
a)

40

12.
b)

15

13.
a)

mean

14.
d)

30

15.
b)

16%

16.
b)

99.7%

17.
a)

26-32

18.
c)

95%

19.
b) 34%
20.
c)

320

คำถามที่พบบ่อย

แบบฝึกหัดการแจกแจงปกติชุดนี้ครอบคลุมหัวข้ออะไรบ้าง?

แบบฝึกหัดสำหรับนักเรียนชั้นมัธยมศึกษาปีที่ 4 (เกรด 11) นี้ ประกอบด้วยคำถามแบบเลือกตอบ 20 ข้อ เพื่อฝึกฝนการตีความกราฟการแจกแจงปกติและการประยุกต์ใช้กฎ 68–95–99.7 นักเรียนจะต้องระบุเปอร์เซ็นต์ที่แรเงา ความหมายของเปอร์เซ็นไทล์ พื้นที่ทั้งหมดของเส้นโค้ง ตำแหน่งของค่าเบี่ยงเบนมาตรฐาน และเปอร์เซ็นต์ของคะแนนที่สูงกว่าค่าที่กำหนด

ฉันจะใช้แบบฝึกหัดนี้ในการสอนเรื่องการแจกแจงแบบปกติได้อย่างไร?

แนะนำค่าเฉลี่ยว่าเป็นจุดศูนย์กลางของเส้นโค้งสมมาตร จากนั้นทบทวนว่าค่าเบี่ยงเบนมาตรฐานหนึ่ง สอง และสาม สอดคล้องกับข้อมูล 68%, 95% และ 99.7% อย่างไร ใช้คำถามเกี่ยวกับพื้นที่แรเงาและกราฟที่มีป้ายกำกับในแบบฝึกหัดเพื่อกระตุ้นความคิดก่อนที่จะขอให้นักเรียนอธิบายว่าทำไมเปอร์เซ็นไทล์หรือเปอร์เซ็นต์ส่วนปลายจึงมีค่าเช่นนั้น

ฉันควรสังเกตข้อผิดพลาดอะไรบ้างเมื่อนักเรียนทำแบบฝึกหัดนี้เสร็จ?

ระวังนักเรียนที่สับสนระหว่างเปอร์เซ็นต์ 68%, 95% และ 99.7% หรือกำหนดให้ส่วนที่แรเงาเป็นเปอร์เซ็นต์ของช่วงทั้งหมด นักเรียนอาจเข้าใจผิดว่าเปอร์เซ็นไทล์เป็นเกรดสอบ อ่านค่าเบี่ยงเบนมาตรฐานเป็นค่าข้อมูลดิบ หรือลืมไปว่าพื้นที่ทั้งหมดใต้เส้นโค้งมีค่าเท่ากับ 1

ฉันจะมอบหมายและให้คะแนนแบบฝึกหัดการแจกแจงปกติชุดนี้ได้อย่างไร?

Wayground จัดเตรียมแบบฝึกหัดนี้ในรูปแบบไฟล์ PDF ที่สามารถพิมพ์ได้ และในรูปแบบแบบทดสอบดิจิทัล โดยมีเฉลยคำตอบครบถ้วนสำหรับคำถามแบบเลือกตอบทั้ง 20 ข้อ การส่งงานในรูปแบบไฟล์ PDF สามารถตรวจได้โดยการสแกนงานของนักเรียนด้วยแอป Wayground for Teachers ในขณะที่แบบทดสอบดิจิทัลรองรับการทำและตรวจงานทางออนไลน์

ฉันจะปรับแบบฝึกหัดเรื่องการแจกแจงปกติให้เหมาะสมกับนักเรียนของฉันได้อย่างไร?

ในส่วนการตั้งค่าขั้นสูงของแบบฝึกหัด ให้ปรับระยะห่างระหว่างตัวอักษรหรือขนาดตัวอักษรเพื่อให้ตัวเลือกแบบปรนัยและแผนภาพเส้นโค้งปกติอ่านง่ายขึ้น นอกจากนี้ คุณยังสามารถใช้แบบอักษรที่เหมาะสำหรับผู้ที่มีภาวะดิสเล็กเซีย หรือแปลแบบฝึกหัดเป็นภาษาอื่นได้ตามความเหมาะสม

ฉันจะหาแบบฝึกหัดแบบนี้เพิ่มเติมได้ที่ไหนบน Wayground?

Wayground นำเสนอชุดแบบฝึกหัดและโจทย์ฝึกหัดฟรีที่ครอบคลุมหลากหลายวิชา พร้อมไฟล์ PDF และเฉลยคำตอบ เพื่อสนับสนุนทักษะและแนวคิดที่สำคัญ ดูแหล่งข้อมูลเพิ่มเติมได้ที่ https://wayground.com/en-us/worksheets
