

 แผ่นงาน
STAAR TEKS 6.12 & 6.13 (Statistics -Data Analysis)
คำถามทั้งหมด: 10

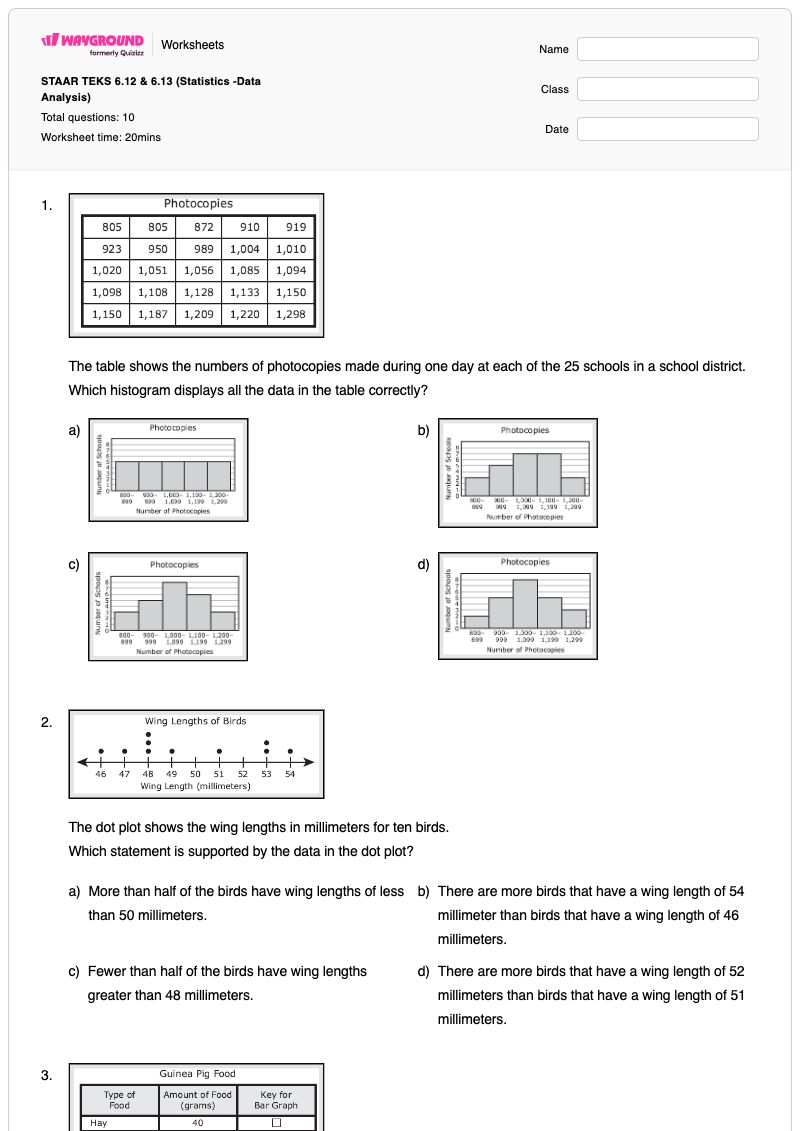
The table shows the numbers of photocopies made during one day at each of the 25 schools in a school district.
Which histogram displays all the data in the table correctly?


The dot plot shows the wing lengths in millimeters for ten birds.
Which statement is supported by the data in the dot plot?
More than half of the birds have wing lengths of less than 50 millimeters.
There are more birds that have a wing length of 54 millimeter than birds that have a wing length of 46 millimeters.
Fewer than half of the birds have wing lengths greater than 48 millimeters.
There are more birds that have a wing length of 52 millimeters than birds that have a wing length of 51 millimeters.

On Saturday Kai gave his guinea pig 80 grams of food. The table shows that mount of each type of food he gave to the guinea pig.
Which percentage bar graph best represents the data?


The list shows the numbers of employees in the nine departments at a company.
14, 23, 6, 54, 30, 26, 17, 3, 26
What is the range of the numbers of employees in these departments? (a)

Each child in a group was asked to choose a single favorite type of cereal. The table shows the number of children who chose each type of cereal as a favorite.
Which statement is NOT supported by the data in the table?
More than 5% of the children chose "other" as the favorite type of cereal.
Oatmeal is the favorite type of cereal for 15% of the children.
Cold cereal is associated with the mode for the favorite type of cereal.
Grits is the favorite type of cereal for 20% of the children.

There are 160 employees who work for the company. The histogram summarizes the time each employee has been in his or her current position at the company.
Based on the histogram, which statement must be true?
There are 5 employees who have been at their current position for 30-35 months.
There are 6 - 11 employees who have been at their current position for 15 months.
Half of the employees have been at their current position 18 or more months.
Half of the employees have been at their current position 11 or fewer months.

The table shows the low temperature in degrees Fahrenheit for a city each day for 12 days.
What is the range of the temperatures in degrees Fahrenheit in the table?
(a)

The bar graph shows the flavors of gum bought yesterday by the customers at a store. Each customer bought only 1 flavor of gum.
Which statement is NOT supported by the data displayed in the bar graph?
The same number of customers bought peppermint as the number of customers who bought cinnamon.
The mode flavor was watermelon.
There were 120 customers who bought gum yesterday.
There was 2.5 times as many customers who bought spearmint as customers who bought peppermint.

The box plot summarizes the finishing times for the runners in a race.
Which statement is best supported by the data in the box plot?
Approximately 50% of the finishing times were less than 25 minutes.
Approximately 41 of the finishing times were greater than 28 minutes.
Approximately 25% of the finishing times were in the interval 20-22 minutes.
Approximately 43 of the finishing times were in the interval 15-30 minutes.

The dot plot shows the number of packages mailed by the last 20 customers at a post office.
Which statement best describes the data shown in the dot plot?
The data distribution has gaps.
The data distribution is symmetrical.
The data are clustered at 5.
the peak of the data is at 10.
แป้นคำตอบSTAAR TEKS 6.12 & 6.13 (Statistics -Data Analysis)
คำถามทั้งหมด: 10
More than half of the birds have wing lengths of less than 50 millimeters.
Oatmeal is the favorite type of cereal for 15% of the children.
There are 5 employees who have been at their current position for 30-35 months.
The mode flavor was watermelon.
Approximately 25% of the finishing times were in the interval 20-22 minutes.
The data distribution has gaps.