

Wayground
Planning and Collecting Data - Printable คณิตศาสตร์ Worksheets ระดับ 9 - Wayground

Planning and Collecting Data

Anthony Clark

สร้างโดย Anthony Clark

20 คำถาม

7th ระดับชั้น

คณิตศาสตร์

แบบฝึกหัดคณิตศาสตร์ชั้น ม.1 เรื่องการวางแผนและการรวบรวมข้อมูลนี้ พัฒนาทักษะการจัดการข้อมูลเชิงปฏิบัติผ่านคำถาม 20 ข้อ ประกอบด้วย แบบฝึกหัดเติมคำในช่องว่าง 9 ข้อ แบบฝึกหัดเลือกตอบ 10 ข้อ และแบบฝึกหัดเลือกคำตอบหลายข้อ 1 ข้อ นักเรียนจะได้ตีความชุดข้อมูลและตารางความถี่ อ่านค่าขีดนับ ระบุค่าต่ำสุดและสูงสุด นับความถี่ภายในช่วง และหาผลรวมจากข้อมูลที่จัดกลุ่ม นอกจากนี้ยังสามารถแยกแยะความแตกต่างระหว่างการทดลอง การสังเกต และการสำรวจในฐานะวิธีการรวบรวมข้อมูล และประยุกต์ใช้การสุ่มตัวอย่างในการสำรวจโรงเรียน แบบฝึกหัดนี้ให้นักเรียนสลับไปมาระหว่างคำตอบเชิงตัวเลข หมวดหมู่คำตอบ และข้อความเกี่ยวกับสิ่งที่ข้อมูลแสดง รวมถึงงานต่างๆ เช่น การบันทึกความถี่เป็นศูนย์เมื่อไม่มีคะแนน การระบุตัวเลือกที่ได้รับความนิยมมากที่สุด การตีความคำตอบจากการสำรวจ และการเลือกข้อสรุปที่ถูกต้องทั้งหมดจากตารางความถี่ แบบฝึกหัดที่พิมพ์ได้ฟรีนี้ออกแบบมาสำหรับการฝึกฝน ทบทวน หรือประเมินผลคณิตศาสตร์ชั้น ม.1 และมีเฉลยคำตอบครบถ้วนเพื่อการตรวจสอบที่มีประสิทธิภาพ

การตั้งค่าแผ่นงาน

ขนาดตัวอักษร

S
M
L
XL
Waygroundแผ่นงาน

Planning and Collecting Data

คำถามทั้งหมด: 20

ชื่อ
ระดับ
วันที่
1.
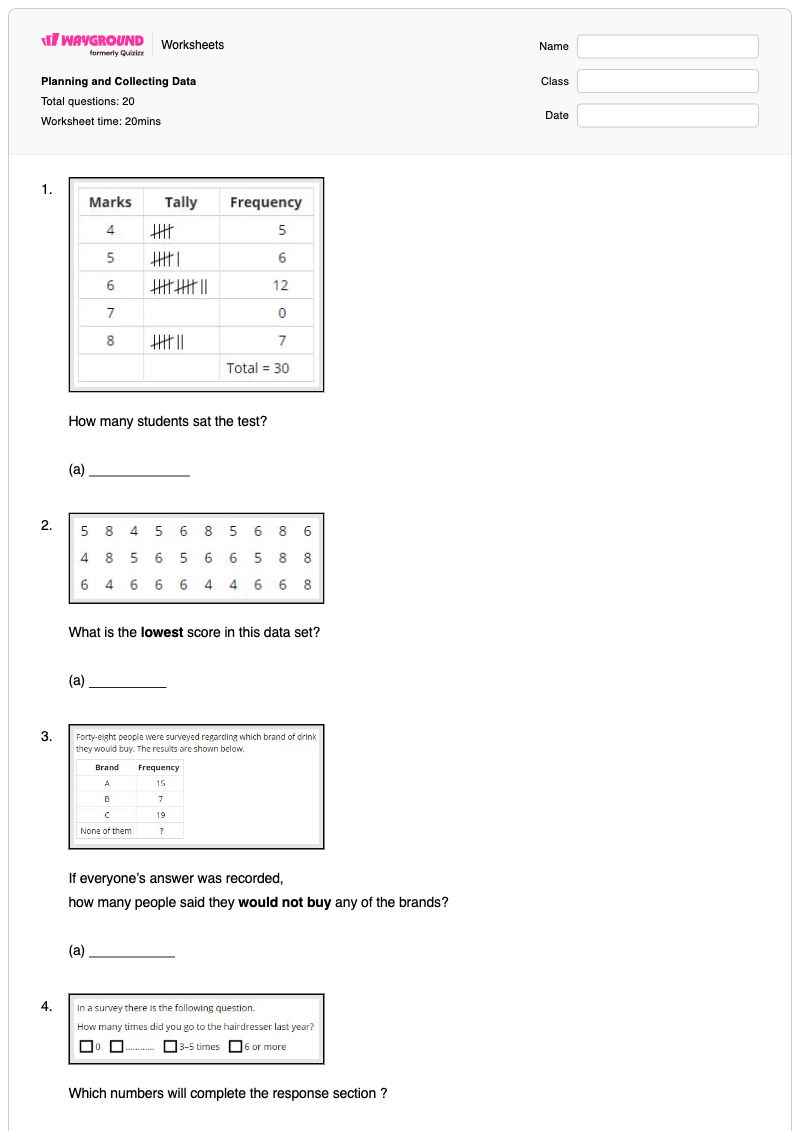
How many students sat the test?

How many students sat the test?

(a)  

2.
What is the lowest score in this data set?

What is the lowest score in this data set?

(a)  

3.
If everyone’s answer was recorded, how many people said they would not buy any of the brands?

If everyone’s answer was recorded,

how many people said they would not buy any of the brands?

(a)  

4.
Which numbers will complete the response section ?

Which numbers will complete the response section ?

(a)  

5.
Which pizza was the most popular on Saturday?

Which pizza was the most popular on Saturday?

a)

Cheese feast

b)

Vegetarian

c)

Meat lovers

d)

Anchovy

6.
If no one scores a mark of 7, you should ......

If no one scores a mark of 7, you should ......

a)

leave the score of 7 out of the frequency table

b)

write 0 in the frequency column for the score of 7

c)

put a cross in the frequency column for the score of 7

7.
What frequency do these tally marks represent?

What frequency do these tally marks represent?

(a)  

8.
Select all the statements that are true.

Select all the statements that are true.

a)

Eight families had 4 children.

b)

The maximum number of children in any family is 4.

c)

Three families had 12 children.

d)

‘7’ in the frequency column means a family had 7 children.

9.
how many students are there who get the point between 10 and 19 ?

how many students are there who get the point between 10 and 19 ?

a)

2

b)

3

10.
how many students are there who spend between 31 and 60 minutes when they study for math exam?

how many students are there  who spend between 31 and 60 minutes when they study  for math exam?

a)

10

b)

9

c)

11

11.

Which method of collection would you use to collect this data ?
How often a slice of buttered bread lands 'butter down' when it is dropped 50 times?

a)

experiment

b)

observation 

c)

survey

12.

Which method of collection would you use to collect this data ?
the number of books owned by people living in your street or village.

a)

experiment

b)

observation

c)

survey

13.

Which method of collection would you use to collect this data ?
the number of people that go  into your local dentist's surgery each hour.

a)

experiment

b)

observation

c)

survey

14.
how many students are there in this class totally ?

how many students are there in this class totally ?

a)

15

b)

16

c)

18

d)

20

15.

There are 948 students in a school. The headteacher wants to know if the students would prefer to have their lunch break at 12.30 pm or 1.30 pm. She decides to ask a sample of the school population. How many students should there be in her sample?

a)

495

b)

98.4

c)

10 % of them

d)

489

16.
Some people were asked to choose their favourite drink out of tea (T), coffee (C), fruit juice (F), and water (W). From the…

Some people were asked to choose their favourite drink out of tea (T), coffee (C), fruit juice (F), and water (W). From the results below what is the most popular drink ?

(a)  

17.
Twenty students were asked to choose their favourite colour out of Red (R), blue (B), green (G), yellow (Y), pink (P) or…

Twenty students were asked to choose their favourite colour out of Red (R), blue (B), green (G), yellow (Y), pink (P) or other (O). Which colour was the most popular ?

(a)  

18.

The population of a village is 986. Mason wants to know how oftern the people in the village use the village hall. He decide to ask a sample of the population. How many people should be in his sample?

a)

a half of the population

b)

all of them

c)

just 10 % of them

d)

250 people

19.
From the data above. How many students had Grade A ?

From the data above. How many students had Grade A ?

(a)  

20.
This is a survey of favourite chocolate in a class of 48 students. Which type is liked more and how many people like it?…

This is a survey of favourite chocolate in a class of 48 students. Which type is liked more and how many people like it? Type the name of chocolate and then the number of people like this: (example only) Mango,31.

(a)  

Waygroundแป้นคำตอบ

Planning and Collecting Data

คำถามทั้งหมด: 20

1.
30, thirty
2.
4, four
3.
7, seven
4.
1-2 times, 1 - 2 times, 1- 2 times, 1 -2 times, 1-2times
5.
b)

Vegetarian

6.
b)

write 0 in the frequency column for the score of 7

7.
17, seventeen
8.
a)

Eight families had 4 children.

, b)

The maximum number of children in any family is 4.

9.
b)

3

10.
c)

11

11.
a)

experiment

12.
c)

survey

13.
b)

observation

14.
d)

20

15.
c)

10 % of them

16.
W, Water
17.
R, Red
18.
c)

just 10 % of them

19.
5, 5 students, five
20.
Vanilla,26.4, vannila,26.4, Vanilla, 26, vanilla,26

คำถามที่พบบ่อย

แบบฟอร์มการวางแผนและการรวบรวมข้อมูลครอบคลุมอะไรบ้าง?

แบบฝึกหัดสำหรับนักเรียนชั้น ม.1 นี้ครอบคลุมการตีความชุดข้อมูลและตารางความถี่ รวมถึงเครื่องหมายนับ ค่าต่ำสุดและสูงสุด ช่วงกลุ่ม ผลรวม และความถี่เป็นศูนย์ นอกจากนี้ยังมีคำถามแบบเติมคำในช่องว่าง คำถามแบบเลือกตอบ และคำถามแบบเลือกคำตอบหลายข้อ ที่ช่วยให้นักเรียนแยกแยะความแตกต่างระหว่างการทดลอง การสังเกต และการสำรวจ และนำการสุ่มตัวอย่างไปใช้ในการสำรวจโรงเรียน

ฉันจะใช้แบบฝึกหัดนี้ในการสอนเรื่องการวางแผนและการรวบรวมข้อมูลได้อย่างไร?

เริ่มต้นด้วยการสาธิตวิธีการสร้างตารางความถี่จากชุดข้อมูล รวมถึงเหตุผลว่าทำไมหมวดหมู่ที่ไม่มีการตอบกลับจึงยังคงได้ค่าความถี่เป็น 0 จากนั้นให้นักเรียนเปรียบเทียบสถานการณ์การทดลอง การสังเกต และการสำรวจในแบบฝึกหัด ก่อนที่จะตอบคำถามเกี่ยวกับการนับช่วงและการสุ่มตัวอย่างแบบสำรวจ ใช้คำถามแบบเลือกหลายข้อเพื่อให้นักเรียนอธิบายเหตุผลของแต่ละข้อความโดยตรงจากข้อมูลความถี่

ฉันควรระวังข้อผิดพลาดอะไรบ้างเมื่อนักเรียนทำแบบฝึกหัดข้อมูลนี้?

นักเรียนอาจสับสนระหว่างค่าในชุดข้อมูลกับความถี่ของค่าดังกล่าว นับกลุ่มห้าในเครื่องหมายนับผิดพลาด หรือละเว้นคะแนนที่มีความถี่เป็นศูนย์ นอกจากนี้ควรระวังข้อผิดพลาดเกี่ยวกับขอบเขตเมื่อนับช่วง เช่น 10–19 หรือ 31–60 และการเลือกเพียงตัวเลือกเดียวในคำถามที่ต้องการคำตอบที่ถูกต้องทั้งหมด นักเรียนบางคนอาจสับสนระหว่างการสังเกตกิจกรรมที่มีอยู่กับการทำการสำรวจหรือการทดลอง

ฉันจะมอบหมายและตรวจงานใบงานนี้อย่างไร?

บน Wayground เนื้อหาเรื่องการวางแผนและการรวบรวมข้อมูลมีให้เลือกทั้งในรูปแบบไฟล์ PDF ที่สามารถพิมพ์ได้ และแบบทดสอบดิจิทัล พร้อมเฉลยคำตอบครบถ้วนสำหรับทั้ง 20 ข้อ คุณสามารถตรวจงานที่ส่งมาในรูปแบบไฟล์ PDF ได้โดยการสแกนงานของนักเรียนด้วยแอป Wayground for Teachers ในขณะที่แบบทดสอบดิจิทัลรองรับการทำและตรวจงานทางออนไลน์

ฉันจะปรับแบบฝึกหัดนี้ให้เหมาะสมกับนักเรียนของฉันได้อย่างไร?

ในการตั้งค่าขั้นสูงของแบบฝึกหัด ให้ปรับระยะห่างระหว่างตัวอักษรและขนาดตัวอักษรเพื่อให้มีพื้นที่มากขึ้นสำหรับนักเรียนในการเขียนคำตอบที่เป็นตัวเลขหรือช่วง นอกจากนี้ คุณยังสามารถเปิดใช้งานแบบอักษรที่เป็นมิตรกับผู้ที่มีภาวะดิสเล็กเซีย หรือแปลแบบฝึกหัดเป็นภาษาอื่น เพื่อช่วยให้นักเรียนเข้าถึงคำถามเกี่ยวกับการนับคะแนน ตารางความถี่ และการเก็บรวบรวมข้อมูลได้ง่ายขึ้น

ฉันจะหาแบบฝึกหัดฟรีแบบนี้เพิ่มเติมได้ที่ไหนบน Wayground?

Wayground มีแบบฝึกหัดและโจทย์ฝึกหัดมากมายให้ดาวน์โหลดฟรีในหลากหลายวิชา พร้อมไฟล์ PDF และเฉลยคำตอบ เพื่อช่วยเสริมสร้างทักษะและความเข้าใจในแนวคิดสำคัญ ดูแหล่งข้อมูลเพิ่มเติมได้ที่ https://wayground.com/en-us/worksheets