Wayground
Writing Equations from Tables, Graphs and Situations - Printable คณิตศาสตร์ Worksheets ระดับ 8 - Wayground

Writing Equations from Tables, Graphs and Situations

Karista Williams

สร้างโดย Karista Williams

16 คำถาม

8th ระดับชั้น

คณิตศาสตร์

อัปเดตแล้ว ต.ค. 2569

แบบฝึกหัดคณิตศาสตร์ ม.2 นี้ช่วยให้นักเรียนเขียนและตีความสมการเชิงเส้นจากตาราง กราฟ และสถานการณ์ในชีวิตจริง นักเรียนระบุว่าความสัมพันธ์เป็นสัดส่วนหรือไม่เป็นสัดส่วน กำหนดค่าความชัน จุดตัดแกน y และค่าคงที่ของสัดส่วน จับคู่กราฟกับสมการ และใช้จุดหรือข้อมูลจากกราฟเพื่อเขียนสมการในรูปแบบ y = mx + b แบบฝึกหัดนี้ใช้สถานการณ์ในชีวิตจริง เช่น น้ำในบ่อ ค่าใช้จ่ายในการลากจูง และบัญชีธนาคาร เพื่อให้นักเรียนเชื่อมโยงค่าเริ่มต้นและอัตราการเปลี่ยนแปลงกับสมการ แบบฝึกหัดนี้ประกอบด้วยคำถามแบบเลือกตอบ 13 ข้อ และแบบฝึกหัดการเขียนสมการแบบปลายเปิด 3 ข้อ ช่วยให้นักเรียนได้ฝึกฝนทั้งการให้เหตุผลแบบเลือกตอบและการแสดงความคิดทางคณิตศาสตร์ แบบฝึกหัดนี้ออกแบบมาสำหรับใช้ในบทเรียนคณิตศาสตร์ ม.2 การฝึกฝนด้วยตนเอง การบ้าน หรือการประเมินผลระหว่างเรียน แบบฝึกหัดนี้สามารถพิมพ์ได้ฟรีพร้อมเฉลยคำตอบครบถ้วน และยังมีให้ใช้งานในรูปแบบดิจิทัลผ่าน Wayground เพื่อการมอบหมายงานและการทบทวนที่ยืดหยุ่น

การตั้งค่าแผ่นงาน

ขนาดตัวอักษร

S
M
L
XL
Waygroundแผ่นงาน

Writing Equations from Tables, Graphs and Situations

คำถามทั้งหมด: 16

ชื่อ
ระดับ
วันที่
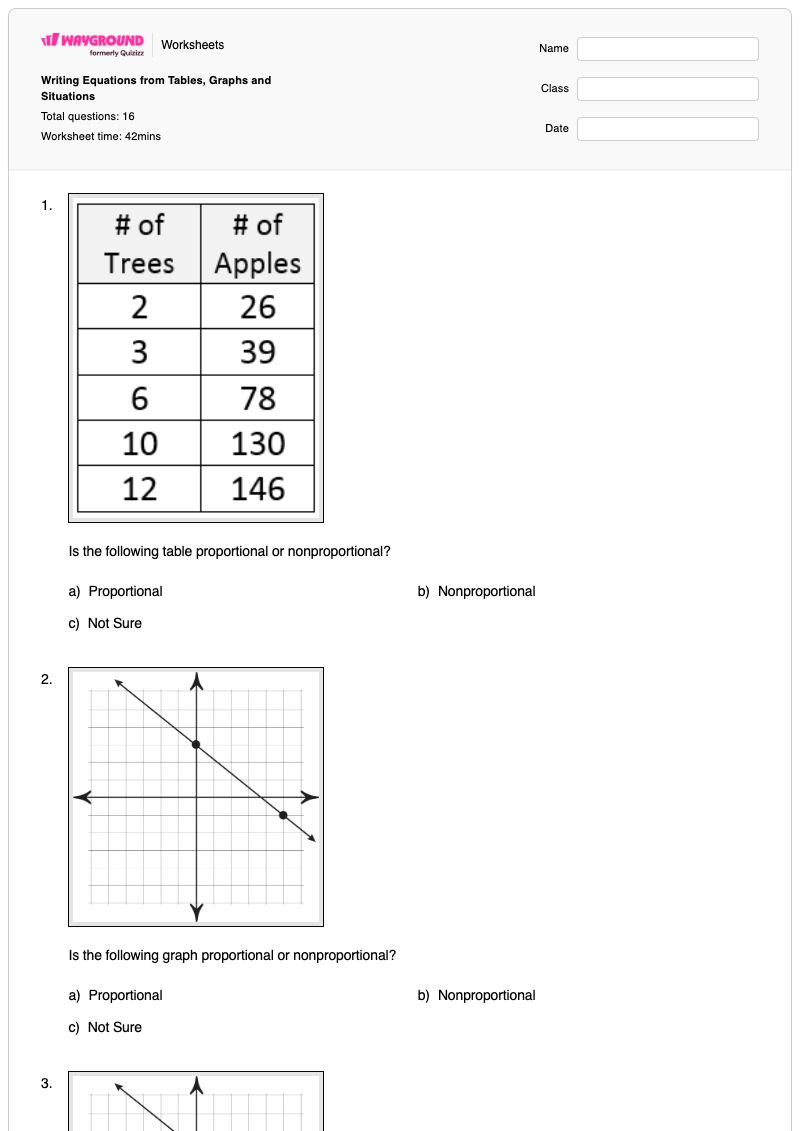
1.
Is the following table proportional or nonproportional?

Is the following table proportional or nonproportional?

a)

Proportional

b)

Nonproportional

c)

Not Sure

2.
Is the following graph proportional or nonproportional?

Is the following graph proportional or nonproportional?

a)

Proportional

b)

Nonproportional

c)

Not Sure

3.
What is the y-intercept (b) of the graph?

What is the y-intercept (b) of the graph?

a)

−45\frac{-4}{5}  

b)

−3-3  

c)

33  

d)

00  

4.

Owners of a recreation area are filling a small pond with water. They are adding water at a rate of 35 liters per minute. There are 600 liters in the pond to start. Write an equation that shows how much water will be in the pond after x minutes.

b = b\ =\  _______

m=m=  _______

a)

y=−35x+600y=-35x+600  

b)

y=35x+600y=35x+600  

c)

y=600x+35y=600x+35  

d)

y=35x−600y=35x-600  

5.

When a tow truck is called, the cost of the service is $45 and they charge a rate of $3 per mile that the car is towed. Write an equation that shows how much it will cost to tow a car for x miles.

b = b\ =\  _______

m=m=  _______

4 เส้น
6.

Mr. Cerna has $3450 in his bank account. He buys Jordan's weekly at a rate of $135 per pair of shoes. Write an equation that shows how much money Mr. Cerna will have after purchasing x amount of shoes.

b = b\ =\  _______

m=m=  _______

4 เส้น
7.
What is the equation of the linear function?
4 เส้น
8.
Which is the graph of y= -x + 2?
Which is the graph of y= -x + 2? 
a)
A
b)
B
c)
C
d)
D
9.

Write an equation of the line that passes through (0 , 10) and (6 , 34)

a)

y = 4x + 10

b)

y = 6x + 34

c)

y = 4

d)

y = 6x - 4

10.
Determine the slope.
Determine the slope. 
a)
-5
b)
5
c)
-1/5
d)
1/5
11.
What is the y - intercept?

What is the y - intercept?

a)

0

b)

5

c)

- 4

d)

4

12.
Based on the graph, Which of the following statements is TRUE?

Based on the graph, Which of the following statements is TRUE?

a)

I drove 80 miles every 4 hours

b)

I drove 160 miles in an hour

c)

I drove 80 miles every 2 hours

d)

I drove 240 miles in 4 hours

13.
Which of the following is an equation for this relationship?

Which of the following is an equation for this relationship?

a)

y=90x

b)

y=25x

c)

y=45x

d)

y=2x

14.
What is the constant of proportionality for the following graph?
a)
80
b)
20
c)
40
d)
160
15.
Identify the constant of proportionality. Write your answer as y=kx

Identify the constant of proportionality. Write your answer as y=kx

a)

y=14x

b)

y=7x

c)

y=2x

d)

y=6x

16.
Which statement below accurately represents the graph?
a)
$100 is earned for each hour worked
b)
$200 earned for every 2 hours worked
is the unit rate
c)
$500 is earned for every 8 hours worked
d)
$300 is earned after working 4 hours
Waygroundแป้นคำตอบ

Writing Equations from Tables, Graphs and Situations

คำถามทั้งหมด: 16

1.
b)

Nonproportional

2.
b)

Nonproportional

3.
c)

33  

4.
b)

y=35x+600y=35x+600  

5.
ไม่มี
6.
ไม่มี
7.
ไม่มี
8.
a) A
9.
a)

y = 4x + 10

10.
a) -5
11.
d)

4

12.
c)

I drove 80 miles every 2 hours

13.
c)

y=45x

14.
c) 40
15.
b)

y=7x

16.
c) $500 is earned for every 8 hours worked

คำถามที่พบบ่อย

แบบฝึกหัดนี้ครอบคลุมเนื้อหาอะไรบ้าง และช่วยให้นักเรียนเขียนสมการเชิงเส้นได้อย่างไร?

แบบฝึกหัดสำหรับนักเรียนชั้น ม.2 นี้ เน้นการเขียนและการตีความสมการเชิงเส้นจากตาราง กราฟ และสถานการณ์ต่างๆ แบบฝึกหัดประกอบด้วยคำถามแบบเลือกตอบและคำถามปลายเปิด โดยนักเรียนจะต้องระบุความสัมพันธ์แบบสัดส่วน ความชัน จุดตัดแกน y และค่าคงที่ของสัดส่วน จากนั้นใช้คุณสมบัติเหล่านั้นในการเลือกหรือสร้างสมการ เช่น y = mx + b

ฉันจะใช้แบบฝึกหัดนี้สอนการเขียนสมการจากกราฟและสถานการณ์ต่างๆ ได้อย่างไร?

เริ่มต้นด้วยการทบทวนความชันในฐานะอัตราการเปลี่ยนแปลงและจุดตัดแกน y ในฐานะค่าเริ่มต้น จากนั้นสร้างแบบจำลองว่าค่าเหล่านั้นปรากฏในสมการได้อย่างไร ใช้ตัวอย่างบ่อ ค่าลากจูง และบัญชีธนาคาร เพื่อให้นักเรียนระบุจำนวนเงินและอัตราเริ่มต้นก่อนที่จะเขียนสมการ และตามด้วยคำถามเกี่ยวกับกราฟและพิกัดเพื่อเชื่อมโยงการแสดงผลเข้าด้วยกัน

ฉันควรสังเกตข้อผิดพลาดอะไรบ้างเมื่อนักเรียนทำแบบฝึกหัดนี้เสร็จ?

ระวังนักเรียนที่สลับความชันและจุดตัดแกน y โดยเฉพาะเมื่ออ่านกราฟหรือใช้จุด เช่น (0, 10) ในโจทย์สถานการณ์ นักเรียนอาจละเว้นจำนวนเริ่มต้นหรือใช้ค่าอัตราที่มีเครื่องหมายผิด ในข้อสอบเรื่องสัดส่วน นักเรียนอาจสับสนระหว่างอัตราส่วนคงที่กับความสัมพันธ์ที่ไม่เป็นสัดส่วน หรือเลือกกราฟโดยไม่ตรวจสอบสมการก่อน

ฉันจะมอบหมายและให้คะแนนแบบฝึกหัดนี้อย่างไร?

แบบฝึกหัดนี้มีให้ดาวน์โหลดในรูปแบบ PDF สำหรับพิมพ์ และเป็นแบบทดสอบดิจิทัลบน Wayground พร้อมเฉลยคำตอบครบถ้วนสำหรับตรวจสอบคำตอบแบบเลือกตอบและคำตอบสมการแบบปลายเปิด การส่งงานแบบพิมพ์สามารถตรวจได้โดยการสแกนงานของนักเรียนด้วยแอป Wayground for Teachers

ฉันจะปรับแบบฝึกหัดนี้ให้เหมาะสมกับนักเรียนของฉันได้อย่างไร?

ในส่วนการตั้งค่าขั้นสูงของแบบฝึกหัด ให้ปรับระยะห่างระหว่างตัวอักษรหรือเลือกขนาดตัวอักษรที่ใหญ่ขึ้นเพื่อให้สมการ ป้ายกำกับกราฟ และคำถามในชีวิตจริงอ่านง่ายขึ้น นอกจากนี้ คุณยังสามารถเปิดใช้งานแบบอักษรที่เหมาะสำหรับผู้ที่มีภาวะดิสเล็กเซีย หรือแปลแบบฝึกหัดเป็นภาษาอื่นเมื่อเห็นว่ามีประโยชน์

ฉันจะหาแบบฝึกหัดฟรีแบบนี้เพิ่มเติมได้ที่ไหนบน Wayground?

Wayground นำเสนอชุดแบบฝึกหัดและโจทย์ฝึกหัดที่สามารถพิมพ์ได้ฟรีอย่างครอบคลุมในทุกวิชา รวมถึงไฟล์ PDF ที่ดาวน์โหลดได้และเฉลยคำตอบ เพื่อช่วยให้นักเรียนเชี่ยวชาญทักษะและแนวคิดที่สำคัญ ดูแหล่งข้อมูลเพิ่มเติมได้ที่ https://wayground.com/en-us/worksheets