

Wayground
Econ U2 practice - Printable สังคมศึกษา Worksheets ระดับ 10 - Wayground

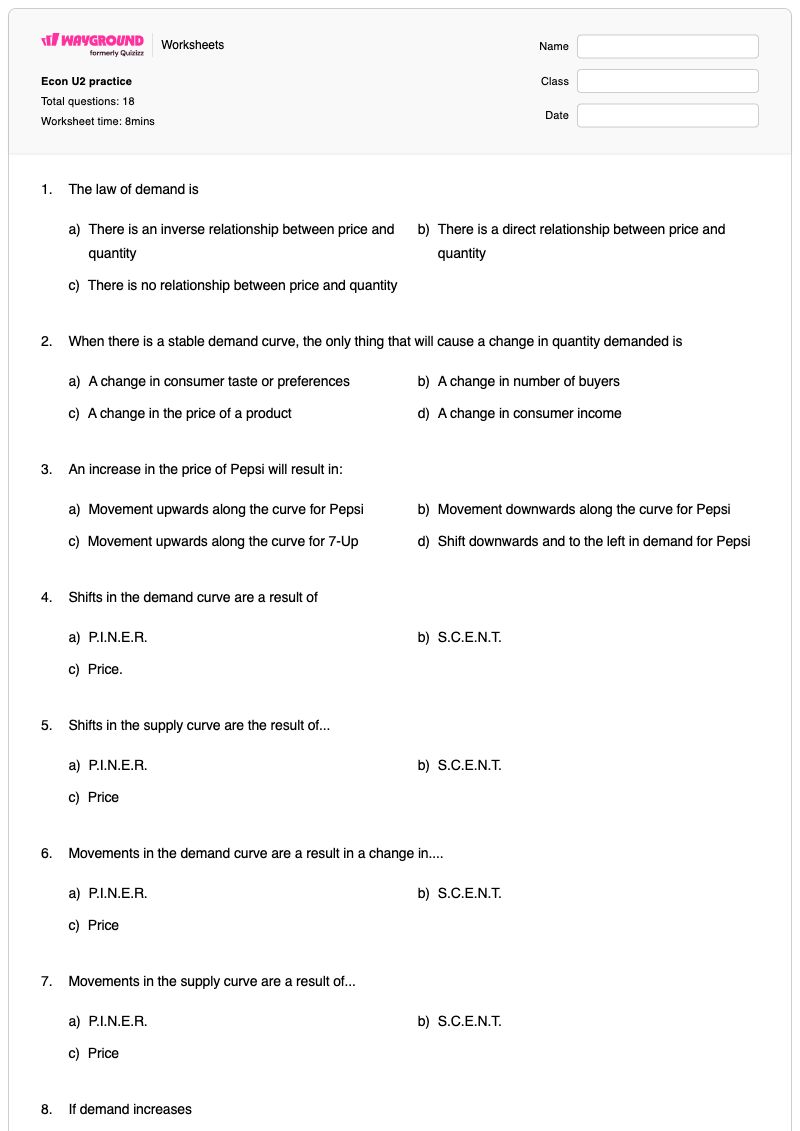
Econ U2 practice

Michael Ford

สร้างโดย Michael Ford

18 คำถาม

9th - 12th ระดับชั้น

สังคมศึกษา

แบบฝึกหัด Econ U2 เป็นแบบฝึกหัดที่พิมพ์ได้ฟรีสำหรับนักเรียนวิชาสังคมศึกษา ระดับชั้น 9-12 เพื่อทบทวนความสัมพันธ์ระหว่างอุปสงค์และอุปทาน แบบฝึกหัดประกอบด้วย 18 ข้อ—17 ข้อเป็นแบบเลือกตอบ และ 1 ข้อเป็นแบบเลือกหลายตัวเลือก—นักเรียนจะได้ระบุถึงกฎของอุปสงค์ แยกแยะความแตกต่างระหว่างการเปลี่ยนแปลงปริมาณความต้องการหรือปริมาณอุปทานกับการเปลี่ยนแปลงของเส้นอุปสงค์หรืออุปทาน และเชื่อมโยงการเปลี่ยนแปลงแต่ละอย่างกับราคาหรือปัจจัยอื่นๆ แบบฝึกหัดนี้ยังรวมถึงคำถามเกี่ยวกับกราฟที่ให้นักเรียนรู้จักการเปลี่ยนแปลงและการเคลื่อนไหวของเส้นอุปสงค์และอุปทาน นักเรียนจะได้ใช้หลักการ P.I.N.E.R. และ S.C.E.N.T. ตีความการเปลี่ยนแปลงของเส้นกราฟ และเลือกปัจจัยที่เกี่ยวข้องทั้งหมด เช่น ความชอบของผู้บริโภค ความคาดหวัง จำนวนผู้ซื้อ และรายได้ มีเฉลยคำตอบครบถ้วนเพื่อความสะดวกในการตรวจสอบ การสอนซ้ำ หรือการทบทวนด้วยตนเอง

การตั้งค่าแผ่นงาน

ขนาดตัวอักษร

S
M
L
XL
Waygroundแผ่นงาน

Econ U2 practice

คำถามทั้งหมด: 18

ชื่อ
ระดับ
วันที่
1.

The law of demand is

a)

There is an inverse relationship between price and quantity

b)

There is a direct relationship between price and quantity

c)

There is no relationship between price and quantity

2.

When there is a stable demand curve, the only thing that will cause a change in quantity demanded is

a)

A change in consumer taste or preferences

b)

A change in number of buyers

c)

A change in the price of a product

d)

A change in consumer income

3.

An increase in the price of Pepsi will result in:

a)

Movement upwards along the curve for Pepsi

b)

Movement downwards along the curve for Pepsi

c)

Movement upwards along the curve for 7-Up

d)

Shift downwards and to the left in demand for Pepsi

4.

Shifts in the demand curve are a result of

a)

P.I.N.E.R.

b)

S.C.E.N.T.

c)

Price.

5.

Shifts in the supply curve are the result of...

a)

P.I.N.E.R.

b)

S.C.E.N.T.

c)

Price

6.

Movements in the demand curve are a result in a change in....

a)

P.I.N.E.R.

b)

S.C.E.N.T.

c)

Price

7.

Movements in the supply curve are a result of...

a)

P.I.N.E.R.

b)

S.C.E.N.T.

c)

Price

8.

If demand increases

a)

There will be a shift to the left

b)

There will be a shift to the right

c)

There will be movement down the curve

d)

There will be movement up the curve

9.

If demand Decreases

a)

There will be movement up the curve

b)

There will be movement down the curve

c)

There will be a shift left

d)

There will be a shift right

10.

An increase in Quantity demanded results in

a)

A movement on the demand curve.

b)

A shift to the left of the demand curve.

c)

A shift to the right of the demand curve.

11.

A shift to the demand curve can be caused by a change in (mark all that are correct)

a)

Consumer preference

b)

Consumer expectations

c)

Number of buyers

d)

Subsidies

e)

Consumer income

12.
The image to the left indicates

The image to the left indicates

a)

A shift in the demand curve

b)

A movement in the demand curve

c)

No change in the demand curve.

13.
The demand curve to the left indicates

The demand curve to the left indicates

a)

A movement along the demand curve

b)

A shift in demand.

14.

Which of these graphs indicates a shift in supply?

a)
Which of these graphs indicates a shift in supply?

b)
Which of these graphs indicates a shift in supply?

c)
Which of these graphs indicates a shift in supply?

d)
Which of these graphs indicates a shift in supply?

15.

Which of these graphs indicates a movement of quantity supplied?

a)
Which of these graphs indicates a movement of quantity supplied?

b)
Which of these graphs indicates a movement of quantity supplied?

c)
Which of these graphs indicates a movement of quantity supplied?

d)
Which of these graphs indicates a movement of quantity supplied?

16.

Which of these is a supply curve?

a)
Which of these is a supply curve?

b)
Which of these is a supply curve?

17.

Which of these is a demand curve?

a)
Which of these is a demand curve?

b)
Which of these is a demand curve?

18.

Which of the following illustrates the concept of diminishing marginal utility

a)

A furniture company buys wood to make furniture.

b)

A furniture company buys less wood because they have a more efficient way to manufacture furniture.

c)

Jayleon buys a car to go to work.

d)

Jayleon gets less enjoyment out of his 5th car than he does from his 1st car.

Waygroundแป้นคำตอบ

Econ U2 practice

คำถามทั้งหมด: 18

1.
a)

There is an inverse relationship between price and quantity

2.
c)

A change in the price of a product

3.
a)

Movement upwards along the curve for Pepsi

4.
a)

P.I.N.E.R.

5.
b)

S.C.E.N.T.

6.
c)

Price

7.
c)

Price

8.
b)

There will be a shift to the right

9.
c)

There will be a shift left

10.
a)

A movement on the demand curve.

11.
a)

Consumer preference

, b)

Consumer expectations

, c)

Number of buyers

, e)

Consumer income

12.
a)

A shift in the demand curve

13.
a)

A movement along the demand curve

14.
b)
15.
b)
16.
b)
17.
a)
18.
d)

Jayleon gets less enjoyment out of his 5th car than he does from his 1st car.

คำถามที่พบบ่อย

แบบฝึกหัดวิชาเศรษฐศาสตร์ระดับ U2 ครอบคลุมเนื้อหาอะไรบ้าง?

แบบฝึกหัด 18 ข้อนี้ช่วยเสริมสร้างความสามารถของนักเรียนในการแยกแยะความแตกต่างระหว่างการเคลื่อนไหวตามเส้นอุปสงค์หรืออุปทานกับการเปลี่ยนแปลงของเส้นกราฟ แบบฝึกหัดนี้ประกอบด้วยคำถามแบบเลือกตอบ 17 ข้อ และคำถามแบบเลือกตอบหลายข้ออีก 1 ข้อ ครอบคลุมหัวข้อกฎของอุปสงค์ การเปลี่ยนแปลงราคา ปัจจัยกำหนด P.I.N.E.R. และ S.C.E.N.T. และการตีความกราฟ เพื่อให้นักเรียนสามารถเชื่อมโยงการเปลี่ยนแปลงทางเศรษฐกิจกับการตอบสนองของเส้นกราฟได้อย่างถูกต้อง

ฉันจะใช้แบบฝึกหัดนี้ในการสอนเรื่องการเปลี่ยนแปลงของเส้นอุปสงค์และอุปทานได้อย่างไร?

เริ่มแบบฝึกหัดโดยเปรียบเทียบการเปลี่ยนแปลงราคากับการเปลี่ยนแปลงปัจจัยที่ไม่ใช่ราคา จากนั้นสาธิตให้เห็นว่าแต่ละอย่างปรากฏบนกราฟอุปสงค์หรืออุปทานอย่างไร ให้นักเรียนอธิบายว่าเหตุใดราคาจึงทำให้เกิดการเคลื่อนไหวไปตามเส้นโค้ง ในขณะที่ปัจจัยต่างๆ เช่น ความชอบ ความคาดหวัง จำนวนผู้ซื้อ หรือรายได้ สามารถทำให้เส้นอุปสงค์เปลี่ยนแปลงไปได้ หลังจากนั้นให้ใช้คำถามเกี่ยวกับกราฟเพื่อตรวจสอบว่านักเรียนสามารถเข้าใจความแตกต่างนี้ได้ด้วยภาพหรือไม่

ฉันควรระวังข้อผิดพลาดอะไรบ้างเมื่อนักเรียนทำแบบฝึกหัดเศรษฐศาสตร์นี้?

ระวังนักเรียนสับสนระหว่างการเพิ่มขึ้นของปริมาณความต้องการกับการเพิ่มขึ้นของอุปสงค์: อย่างแรกคือการเคลื่อนที่ไปตามเส้นอุปสงค์ ในขณะที่อย่างหลังคือการเลื่อนไปทางขวา นักเรียนอาจเลือกราคาเป็นสาเหตุของการเลื่อนของเส้น หรือสับสนระหว่างตัวบ่งชี้ P.I.N.E.R. สำหรับการเลื่อนของอุปสงค์กับตัวบ่งชี้ S.C.E.N.T. สำหรับการเปลี่ยนแปลงของอุปทาน ในข้อสอบแบบเลือกหลายข้อ ให้ตรวจสอบว่านักเรียนระบุปัจจัยการเปลี่ยนแปลงของอุปสงค์ที่เกี่ยวข้องทั้งหมด แทนที่จะเลือกเพียงปัจจัยเดียว

ฉันจะมอบหมายและตรวจแบบฝึกหัดวิชาเศรษฐศาสตร์ระดับ U2 นี้อย่างไร?

แบบฝึกหัดนี้มีให้ดาวน์โหลดเป็นไฟล์ PDF สำหรับพิมพ์ และเป็นแบบทดสอบดิจิทัลบน Wayground โดยมีเฉลยคำตอบครบถ้วนสำหรับทั้ง 18 ข้อ สำหรับการส่งงานแบบพิมพ์ คุณสามารถสแกนงานของนักเรียนด้วยแอป Wayground for Teachers เพื่อใช้ในการตรวจและให้คะแนนได้

ฉันจะปรับแบบฝึกหัดเรื่องอุปสงค์และอุปทานนี้ให้เหมาะสมกับนักเรียนของฉันได้อย่างไร?

เนื่องจากแบบฝึกหัดนี้ประกอบด้วยคำถามแบบเลือกตอบหลายตัวเลือกพร้อมคำถามเกี่ยวกับกราฟอุปสงค์และอุปทาน คุณจึงสามารถปรับระยะห่างระหว่างตัวอักษรและขนาดตัวอักษรเพื่อให้ข้อความและป้ายกำกับกราฟอ่านง่ายขึ้น นอกจากนี้ ในการตั้งค่าขั้นสูงของแบบฝึกหัด คุณยังสามารถเลือกแบบอักษรที่เหมาะสำหรับผู้ที่มีภาวะดิสเล็กเซีย หรือแปลแบบฝึกหัดเป็นภาษาอื่นได้ตามความเหมาะสม

ฉันจะหาแบบฝึกหัดแบบนี้เพิ่มเติมได้ที่ไหนบน Wayground?

Wayground นำเสนอชุดแบบฝึกหัดและโจทย์ฝึกหัดฟรีที่ครอบคลุมหลากหลายวิชา พร้อมไฟล์ PDF และเฉลยคำตอบ เพื่อช่วยให้นักเรียนเชี่ยวชาญทักษะและแนวคิดที่สำคัญ ดูแหล่งข้อมูลเพิ่มเติมได้ที่ https://wayground.com/en-us/worksheets