

Wayground
STAAR TEKS 6.12 & 6.13 (Statistics -Data Analysis) - Printable คณิตศาสตร์ Worksheets โรงเรียนอนุบาล - Wayground

STAAR TEKS 6.12 & 6.13 (Statistics -Data Analysis)

Victoria Simmons

สร้างโดย Victoria Simmons

10 คำถาม

6th ระดับชั้น

คณิตศาสตร์

อัปเดตแล้ว ก.ย. 2569

แบบฝึกหัดคณิตศาสตร์ชั้นประถมศึกษาปีที่ 6 นี้ สอดคล้องกับมาตรฐาน STAAR TEKS 6.12 และ 6.13 โดยมีคำถามวิเคราะห์ข้อมูล 10 ข้อ นักเรียนจะได้ตีความและเปรียบเทียบฮิสโตแกรม แผนภาพจุด แผนภูมิแท่ง แผนภูมิแท่งร้อยละ และแผนภาพกล่อง คำนวณพิสัยของชุดข้อมูล ระบุค่าฐานนิยม และพิจารณาว่าข้อความใดได้รับการสนับสนุนหรือไม่ได้รับการสนับสนุนจากข้อมูลที่แสดง คำถามประกอบด้วยคำถามแบบเลือกตอบ 8 ข้อ คำถามแบบลากและวางหาพิสัย 1 ข้อ และคำถามแบบเติมคำในช่องว่างหาพิสัย 1 ข้อ แบบฝึกหัดนี้ช่วยให้นักเรียนเชื่อมโยงการแสดงภาพกับเหตุผลเชิงตัวเลขและสถิติ พวกเขาต้องอ่านความถี่ เปรียบเทียบหมวดหมู่ ตีความลักษณะการกระจาย เช่น ช่องว่างและช่วงควาร์ไทล์ และคำนวณพิสัยจากรายการหรือตาราง แทนที่จะพึ่งพาการประมาณค่าด้วยสายตาเพียงอย่างเดียว แบบฝึกหัดนี้ออกแบบมาสำหรับการฝึกฝน ทบทวน หรือประเมินผลระหว่างเรียนวิชาคณิตศาสตร์ชั้นประถมศึกษาปีที่ 6 ที่สอดคล้องกับมาตรฐานของรัฐเท็กซัสที่ระบุไว้ แบบฝึกหัดที่พิมพ์ได้ฟรีนี้มีเฉลยคำตอบครบถ้วนเพื่อการตรวจสอบและให้ข้อเสนอแนะอย่างมีประสิทธิภาพ

การตั้งค่าแผ่นงาน

ขนาดตัวอักษร

S
M
L
XL
Waygroundแผ่นงาน

STAAR TEKS 6.12 & 6.13 (Statistics -Data Analysis)

คำถามทั้งหมด: 10

ชื่อ
ระดับ
วันที่
1.
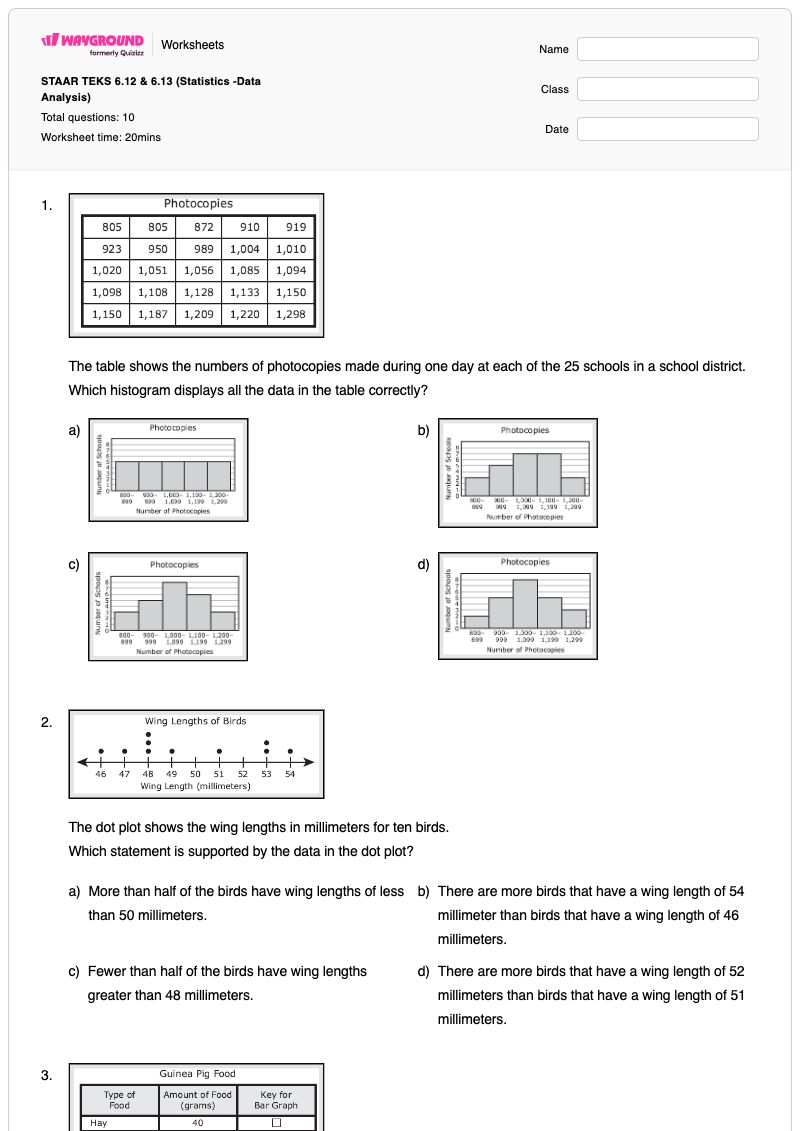
The table shows the numbers of photocopies made during one day at each of the 25 schools in a school district. Which…

The table shows the numbers of photocopies made during one day at each of the 25 schools in a school district.

Which histogram displays all the data in the table correctly?

a)
The table shows the numbers of photocopies made during one day at each of the 25 schools in a school district. Which…

b)
The table shows the numbers of photocopies made during one day at each of the 25 schools in a school district. Which…

c)
The table shows the numbers of photocopies made during one day at each of the 25 schools in a school district. Which…

d)
The table shows the numbers of photocopies made during one day at each of the 25 schools in a school district. Which…

2.
The dot plot shows the wing lengths in millimeters for ten birds. Which statement is supported by the data in the dot plot?

The dot plot shows the wing lengths in millimeters for ten birds.

Which statement is supported by the data in the dot plot?

a)

More than half of the birds have wing lengths of less than 50 millimeters.

b)

There are more birds that have a wing length of 54 millimeter than birds that have a wing length of 46 millimeters.

c)

Fewer than half of the birds have wing lengths greater than 48 millimeters.

d)

There are more birds that have a wing length of 52 millimeters than birds that have a wing length of 51 millimeters.

3.
On Saturday Kai gave his guinea pig 80 grams of food. The table shows that mount of each type of food he gave to the guinea…

On Saturday Kai gave his guinea pig 80 grams of food. The table shows that mount of each type of food he gave to the guinea pig.

Which percentage bar graph best represents the data?

a)
On Saturday Kai gave his guinea pig 80 grams of food. The table shows that mount of each type of food he gave to the guinea…

b)
On Saturday Kai gave his guinea pig 80 grams of food. The table shows that mount of each type of food he gave to the guinea…

c)
On Saturday Kai gave his guinea pig 80 grams of food. The table shows that mount of each type of food he gave to the guinea…

d)
On Saturday Kai gave his guinea pig 80 grams of food. The table shows that mount of each type of food he gave to the guinea…

4.

The list shows the numbers of employees in the nine departments at a company.

14, 23, 6, 54, 30, 26, 17, 3, 26

What is the range of the numbers of employees in these departments?​ (a)  

เลือกจากคำด้านล่าง
51
23
26
18
5.
Each child in a group was asked to choose a single favorite type of cereal. The table shows the number of children who chose…

Each child in a group was asked to choose a single favorite type of cereal. The table shows the number of children who chose each type of cereal as a favorite.

Which statement is NOT supported by the data in the table?

a)

More than 5% of the children chose "other" as the favorite type of cereal.

b)

Oatmeal is the favorite type of cereal for 15% of the children.

c)

Cold cereal is associated with the mode for the favorite type of cereal.

d)

Grits is the favorite type of cereal for 20% of the children.

6.
There are 160 employees who work for the company. The histogram summarizes the time each employee has been in his or her…

There are 160 employees who work for the company. The histogram summarizes the time each employee has been in his or her current position at the company.

Based on the histogram, which statement must be true?

a)

There are 5 employees who have been at their current position for 30-35 months.

b)

There are 6 - 11 employees who have been at their current position for 15 months.

c)

Half of the employees have been at their current position 18 or more months.

d)

Half of the employees have been at their current position 11 or fewer months.

7.
The table shows the low temperature in degrees Fahrenheit for a city each day for 12 days. What is the range of the…

The table shows the low temperature in degrees Fahrenheit for a city each day for 12 days.

What is the range of the temperatures in degrees Fahrenheit in the table?

(a)  

8.
The bar graph shows the flavors of gum bought yesterday by the customers at a store. Each customer bought only 1 flavor of…

The bar graph shows the flavors of gum bought yesterday by the customers at a store. Each customer bought only 1 flavor of gum.

Which statement is NOT supported by the data displayed in the bar graph?

a)

The same number of customers bought peppermint as the number of customers who bought cinnamon.

b)

The mode flavor was watermelon.

c)

There were 120 customers who bought gum yesterday.

d)

There was 2.5 times as many customers who bought spearmint as customers who bought peppermint.

9.
The box plot summarizes the finishing times for the runners in a race. Which statement is best supported by the data in the…

The box plot summarizes the finishing times for the runners in a race.

Which statement is best supported by the data in the box plot?

a)

Approximately 50% of the finishing times were less than 25 minutes.

b)

Approximately 14\frac{1}{4} of the finishing times were greater than 28 minutes.

c)

Approximately 25% of the finishing times were in the interval 20-22 minutes.

d)

Approximately 34\frac{3}{4} of the finishing times were in the interval 15-30 minutes.

10.
The dot plot shows the number of packages mailed by the last 20 customers at a post office. Which statement best describes…

The dot plot shows the number of packages mailed by the last 20 customers at a post office.

Which statement best describes the data shown in the dot plot?

a)

The data distribution has gaps.

b)

The data distribution is symmetrical.

c)

The data are clustered at 5.

d)

the peak of the data is at 10.

Waygroundแป้นคำตอบ

STAAR TEKS 6.12 & 6.13 (Statistics -Data Analysis)

คำถามทั้งหมด: 10

1.
c)
2.
a)

More than half of the birds have wing lengths of less than 50 millimeters.

3.
d)
4.
51
5.
b)

Oatmeal is the favorite type of cereal for 15% of the children.

6.
a)

There are 5 employees who have been at their current position for 30-35 months.

7.
31
8.
b)

The mode flavor was watermelon.

9.
c)

Approximately 25% of the finishing times were in the interval 20-22 minutes.

10.
a)

The data distribution has gaps.

คำถามที่พบบ่อย

แบบฝึกหัดการวิเคราะห์ข้อมูลสำหรับนักเรียนชั้นประถมศึกษาปีที่ 6 นี้ครอบคลุมหัวข้ออะไรบ้าง?

แบบฝึกหัดนี้ฝึกฝนการตีความฮิสโตแกรม แผนภาพจุด แผนภูมิแท่ง แผนภูมิแท่งแสดงเปอร์เซ็นต์ และแผนภาพกล่อง รวมถึงการคำนวณพิสัยและการระบุค่าฐานนิยม แบบฝึกหัด 10 ข้อนี้ต้องการให้นักเรียนเลือกข้อความที่ได้รับการสนับสนุนหรือไม่ได้รับการสนับสนุนจากข้อมูล เลือกรูปแบบกราฟที่ถูกต้อง ค้นหาพิสัยโดยใช้การลากและวางและการเติมคำในช่องว่าง และตีความลักษณะการกระจาย เช่น ช่องว่างและช่วงควาร์ไทล์

ฉันจะใช้แบบฝึกหัดนี้ในการสอนการวิเคราะห์ข้อมูลและช่วงค่าได้อย่างไร?

นำเสนอแผนภูมิทีละแผนภูมิ และให้นักเรียนระบุว่ากราฟหรือแผนภูมิแต่ละอันแสดงถึงอะไร ก่อนที่จะอภิปรายตัวเลือกคำตอบ สาธิตการหาพิสัยโดยการนำค่ามากที่สุดลบด้วยค่าน้อยที่สุด โดยใช้ข้อมูลพนักงานและอุณหภูมิ จากนั้นขอให้นักเรียนอธิบายข้อสรุปจากกราฟด้วยความถี่ ร้อยละ หรือช่วงที่เฉพาะเจาะจง ใช้คำถามที่สนับสนุน/ไม่สนับสนุน เพื่อกระตุ้นให้นักเรียนแยกแยะหลักฐานออกจากข้อสมมติฐาน

ฉันควรระวังข้อผิดพลาดอะไรบ้างในแบบฟอร์มวิเคราะห์ข้อมูลนี้?

นักเรียนอาจสับสนระหว่างพิสัยกับค่าที่มากที่สุด อ่านมาตราส่วนของกราฟผิด หรือเปรียบเทียบความสูงของแท่งกราฟโดยไม่ตรวจสอบช่วงตัวเลข นอกจากนี้ พวกเขาอาจสับสนระหว่างค่าฐานนิยมกับจุดสูงสุดที่มองเห็นได้ทั่วไป ถือว่าข้อความที่ระบุว่า “ไม่ได้รับการสนับสนุน” เป็นความจริง หรือตีความช่วง 25%, 50% และช่วงอื่นๆ ที่แสดงในแผนภาพกล่องผิด ควรระวังนักเรียนที่เลือกกราฟที่คล้ายกับข้อมูล แต่ไม่ได้ครอบคลุมทุกค่าหรือความถี่

ฉันจะมอบหมายและให้คะแนนแบบฝึกหัดการวิเคราะห์ข้อมูลนี้ได้อย่างไร?

แบบฝึกหัดนี้มีให้เลือกทั้งแบบไฟล์ PDF ที่สามารถพิมพ์ได้ และแบบทดสอบดิจิทัลบน Wayground พร้อมเฉลยคำตอบครบถ้วน สามารถใช้ไฟล์ PDF สำหรับฝึกเขียน หรือใช้แบบทดสอบดิจิทัลสำหรับการตอบคำถามและตรวจให้คะแนนออนไลน์ สำหรับการส่งงานแบบพิมพ์ คุณสามารถสแกนงานของนักเรียนด้วยแอป Wayground for Teachers เพื่อให้การตรวจให้คะแนนง่ายขึ้น

ฉันจะปรับแบบฝึกหัดนี้ให้เหมาะสมกับนักเรียนของฉันได้อย่างไร?

ใช้การตั้งค่าขั้นสูงของแบบฝึกหัดเพื่อปรับระยะห่างระหว่างตัวอักษรและขนาดตัวอักษร เพื่อให้คำถามแบบกราฟ ตัวเลือกคำตอบ และรายการช่วงค่าอ่านง่ายขึ้น นอกจากนี้ คุณยังสามารถเปิดใช้งานแบบอักษรที่เหมาะสำหรับผู้ที่มีภาวะดิสเล็กเซีย หรือแปลแบบฝึกหัดเป็นภาษาอื่นได้หากจำเป็น ตัวเลือกเหล่านี้ช่วยให้เข้าถึงรูปแบบคำถามแบบเลือกตอบ ลากและวาง และเติมคำในช่องว่างของแบบฝึกหัดได้โดยไม่ต้องเปลี่ยนแปลงงานวิเคราะห์ข้อมูล

ฉันจะหาแบบฝึกหัดฟรีแบบนี้เพิ่มเติมได้ที่ไหนบน Wayground?

Wayground นำเสนอชุดแบบฝึกหัดและโจทย์ฝึกหัดฟรีที่ครอบคลุมหลากหลายวิชา พร้อมไฟล์ PDF และเฉลยคำตอบ เพื่อช่วยให้นักเรียนเชี่ยวชาญทักษะและแนวคิดที่สำคัญ ดูแหล่งข้อมูลเพิ่มเติมได้ที่ https://wayground.com/en-us/worksheets