

Wayground
Graphing and Data Analysis - Printable Science Worksheets - Wayground

Graphing and Data Analysis

20 คำถาม

6th - 8th ระดับชั้น

Science

แบบฝึกหัดวิทยาศาสตร์เรื่องการสร้างกราฟและการวิเคราะห์ข้อมูล สำหรับนักเรียนชั้นประถมศึกษาปีที่ 6-8 สามารถพิมพ์ได้ฟรี แบบฝึกหัดนี้ช่วยพัฒนาความสามารถของนักเรียนในการระบุ ตีความ และเปรียบเทียบการแสดงข้อมูลทั่วไป ประกอบด้วย 20 ข้อ—18 ข้อเป็นคำถามแบบเลือกตอบ และ 2 ข้อเป็นคำถามแบบเลือกตอบหลายข้อ—นักเรียนจะได้เรียนรู้เกี่ยวกับกราฟวงกลม กราฟแท่ง กราฟเส้น กราฟรูปภาพ และแผนภาพกระจาย จากนั้นเชื่อมโยงการแสดงข้อมูลแต่ละแบบเข้ากับวัตถุประสงค์ เช่น การแสดงส่วนต่างๆ ของทั้งหมด หรือการเปลี่ยนแปลงเมื่อเวลาผ่านไป แบบฝึกหัดนี้ยังให้นักเรียนอ่านค่าจากกราฟ ทำนายจากแผนภาพกระจาย คำนวณพิสัยซึ่งเป็นผลต่างระหว่างค่าสูงสุดและค่าต่ำสุด และหาค่ามัธยฐานและเปอร์เซ็นต์ของข้อมูล แบบฝึกหัดนี้มีประโยชน์สำหรับการฝึกฝนแบบมีผู้แนะนำ การทบทวนด้วยตนเอง หรือการตรวจสอบทักษะการวิเคราะห์ข้อมูลของนักเรียนระดับมัธยมต้น แบบฝึกหัดนี้มีให้ดาวน์โหลดเป็นไฟล์ PDF ฟรี และมีเฉลยคำตอบครบถ้วนเพื่อการตรวจสอบที่มีประสิทธิภาพ

การตั้งค่าแผ่นงาน

ขนาดตัวอักษร

S
M
L
XL
แผ่นงาน

Graphing and Data Analysis

คำถามทั้งหมด: 20

ชื่อ
ระดับ
วันที่
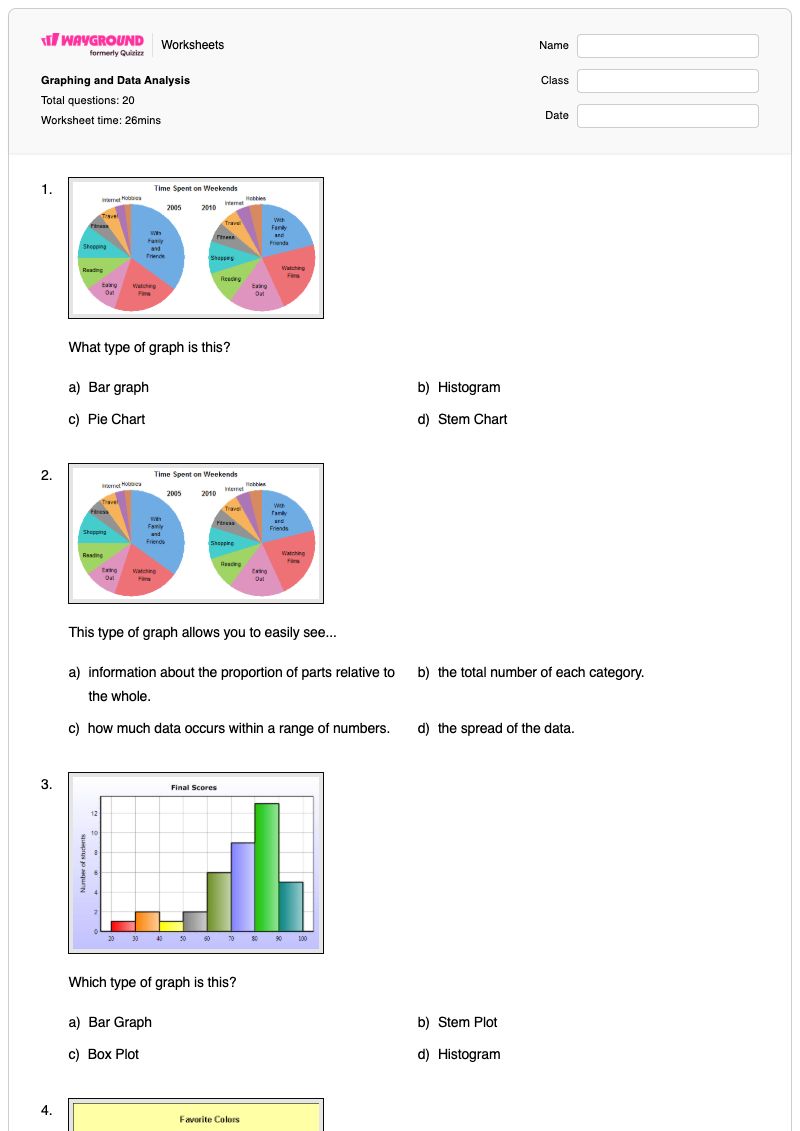
1.
What type of graph is this?
a)
Bar graph
b)
Histogram
c)
Pie Chart
d)
Stem Chart
2.

This type of graph allows you to easily see...

a)

information about the proportion of parts relative to the whole.

b)

the total number of each category.

c)

how much data occurs within a range of numbers.

d)

the spread of the data.

3.
Which type of graph is this?
a)
Bar Graph
b)
Stem Plot
c)
Box Plot
d)
Histogram
4.
How many more people like purple than red?
a)
3
b)
5
c)
7
d)
9
5.
What type of graph is this?
a)
Bar Graph
b)
Line Plot
c)
Pictograph
d)
Tally Chart
6.
Which type of graph shows change over time?
a)
bar graph
b)
line graph
c)
circle graph
7.
I have no axes at all. I help compare parts to a whole. What am I?
a)
Circle Graph
b)
Histogram
c)
Line Graph
d)
Bar Graph
8.
I have an x-axis and a y-axis. I help to track changes over time. What am I?
a)
Circle Graph
b)
Histogram
c)
Line Graph
d)
Dot Plot
9.
What type of graph is this?
a)
Line Graph
b)
Pictograph
c)
Bar Graph
d)
Histogram
10.

What type of graph is this?

a)

circle graph

b)

pictograph

c)

line graph

11.

Phil collected data from several of his friends about the number of hours they spent sleeping and the number of hours they spent playing video games on Saturday. He recorded the data in the scatterplot.


Based on the scatterplot, what is the best prediction of the number of hours one of Phil's friends spends sleeping when the friend spends 1 hour playing video games?

a)

9 hours

b)

11 hours

c)

7 hours

d)

8 hours

12.
1. Which of the following best describes the process of finding the range for a set of data?
a)
ADD the biggest and smallest numbers
b)
Place the number in order from least to greatest then find the middle.
c)
Find the difference between the Maximum and the Minimum.
d)
Find the average.
13.
6. Which city has a higher median?
a)
Millersburg
b)
Arcadia
14.
11. What percentage of the data is between 90 and 140?
a)
25 %
b)
50%
c)
75%
d)
100%
15.
What is the median?
a)
62
b)
58
c)
66
d)
60
16.

This type of data is limited to facts, statistics, figures, numerical information, percentages.

a)

Quantitative

b)

Qualitative

17.

This type of data includes but is not limited to words, pictures, discussions, audio and video recordings, comments, observations.

a)

Quantitative

b)

Qualitative

18.
Which method of collection would you use to collect this data ?
How often a slice of buttered bread lands 'butter down' when it is dropped 50 times?
a)
experiment
b)
observation 
c)
survey
19.
What type of graph is this?
a)
bar graph
b)
pictograph
c)
tally chart
20.

Information collected during an experiment is called

a)

prediction

b)

data

c)

labels

แป้นคำตอบ

Graphing and Data Analysis

คำถามทั้งหมด: 20

1.
c) Pie Chart
2.
a)

information about the proportion of parts relative to the whole.

3.
d) Histogram
4.
b) 5
5.
a) Bar Graph
6.
b) line graph
7.
a) Circle Graph
8.
c) Line Graph
9.
a) Line Graph
10.
b)

pictograph

11.
a)

9 hours

12.
c) Find the difference between the Maximum and the Minimum.
13.
b) Arcadia
14.
b) 50%
15.
a) 62
16.
a)

Quantitative

17.
b)

Qualitative

18.
a) experiment
19.
c) tally chart
20.
b)

data

คำถามที่พบบ่อย

แบบฝึกหัดการสร้างกราฟและการวิเคราะห์ข้อมูลครอบคลุมหัวข้ออะไรบ้าง?

แบบฝึกหัดวิทยาศาสตร์สำหรับนักเรียนชั้น ป.6-ม.2 นี้ ประกอบด้วยข้อสอบแบบเลือกตอบ 18 ข้อ และข้อสอบแบบเลือกตอบหลายข้อ 2 ข้อ เพื่อประเมินความสามารถในการระบุแผนภูมิและการตีความข้อมูล นักเรียนจะได้แยกแยะความแตกต่างระหว่างแผนภูมิวงกลม แผนภูมิแท่ง แผนภูมิเส้น แผนภูมิรูปภาพ และแผนภูมิกระจาย อธิบายสิ่งที่แต่ละแผนภูมิแสดง อ่านค่า ทำนายจากแผนภูมิกระจาย และวิเคราะห์พิสัย มัธยฐาน และร้อยละ

ฉันจะใช้แบบฝึกหัดนี้ในการสอนเรื่องประเภทของกราฟและการวิเคราะห์ข้อมูลได้อย่างไร?

เริ่มต้นด้วยการทบทวนวัตถุประสงค์และลักษณะทาง視覚ของกราฟแต่ละประเภท รวมถึงแกน หมวดหมู่ ส่วนต่างๆ ของทั้งหมด และการเปลี่ยนแปลงเมื่อเวลาผ่านไป ให้นักเรียนอธิบายว่าเหตุใดการแสดงผลแบบใดจึงเหมาะสมกับคำถามแต่ละข้อ ก่อนที่จะทำแบบฝึกหัดการระบุประเภทกราฟ จากนั้นใช้คำถามเกี่ยวกับพิสัย มัธยฐาน เปอร์เซ็นต์ และแผนภาพกระจายจุด เพื่อฝึกฝนการตีความข้อมูลแทนที่จะเพียงแค่ตั้งชื่อกราฟ

ฉันควรสังเกตข้อผิดพลาดอะไรบ้างเมื่อนักเรียนทำแบบฝึกหัดนี้เสร็จ?

นักเรียนอาจสับสนระหว่างฮิสโตแกรมกับกราฟแท่ง หรือเลือกใช้กราฟเส้นโดยไม่ตรวจสอบว่าข้อมูลแสดงการเปลี่ยนแปลงตามเวลาหรือไม่ ระวังข้อผิดพลาดในการอ่านกราฟวงกลมว่าเป็นผลรวมแทนที่จะเป็นสัดส่วน การหาพิสัยโดยการบวกค่าต่ำสุดออกจากค่าสูงสุดแทนที่จะลบ และการเลือกการทำนายจากแผนภาพกระจายโดยไม่ตรงกับค่าป้อนเข้าที่ต้องการ

ฉันจะมอบหมายและให้คะแนนแบบฝึกหัดการสร้างกราฟและการวิเคราะห์ข้อมูลนี้ได้อย่างไร?

Wayground จัดเตรียมแบบฝึกหัดนี้ในรูปแบบไฟล์ PDF ที่สามารถพิมพ์ได้ และในรูปแบบแบบทดสอบดิจิทัล พร้อมเฉลยคำตอบครบถ้วนสำหรับทั้ง 20 ข้อ คุณสามารถตรวจงานที่ส่งมาในรูปแบบไฟล์ PDF ได้โดยการสแกนงานของนักเรียนด้วยแอป Wayground for Teachers หรือตรวจสอบคำตอบจากแบบทดสอบดิจิทัลได้

ฉันจะปรับแบบฝึกหัดนี้ให้เหมาะสมกับนักเรียนของฉันได้อย่างไร?

ใช้การตั้งค่าขั้นสูงของแบบฝึกหัดเพื่อปรับระยะห่างระหว่างตัวอักษรหรือขนาดตัวอักษร เพื่อให้ป้ายกำกับกราฟ ตัวเลือกคำตอบ และข้อความแจ้งเตือนการวิเคราะห์ข้อมูลอ่านง่ายขึ้น นอกจากนี้ คุณยังสามารถเปิดใช้งานแบบอักษรที่เหมาะสำหรับผู้ที่มีภาวะดิสเล็กเซีย หรือแปลแบบฝึกหัดเป็นภาษาอื่นในขณะที่นักเรียนกำลังทำแบบฝึกหัดการระบุและการตีความกราฟได้อีกด้วย

ฉันจะหาแบบฝึกหัดแบบนี้เพิ่มเติมได้ที่ไหนบน Wayground?

Wayground นำเสนอชุดแบบฝึกหัดและโจทย์ฝึกหัดฟรีที่ครอบคลุมหลากหลายวิชา พร้อมไฟล์ PDF และเฉลยคำตอบ เพื่อสนับสนุนทักษะและแนวคิดที่สำคัญ ดูแหล่งข้อมูลเพิ่มเติมได้ที่ https://wayground.com/en-us/worksheets
