

Wayground
Proportional Relationships in Graphs - Printable คณิตศาสตร์ Worksheets ระดับ 7 - Wayground

Proportional Relationships in Graphs

MEAGHAN ESRICK

สร้างโดย MEAGHAN ESRICK

17 คำถาม

7th ระดับชั้น

คณิตศาสตร์

อัปเดตแล้ว ก.ย. 2569

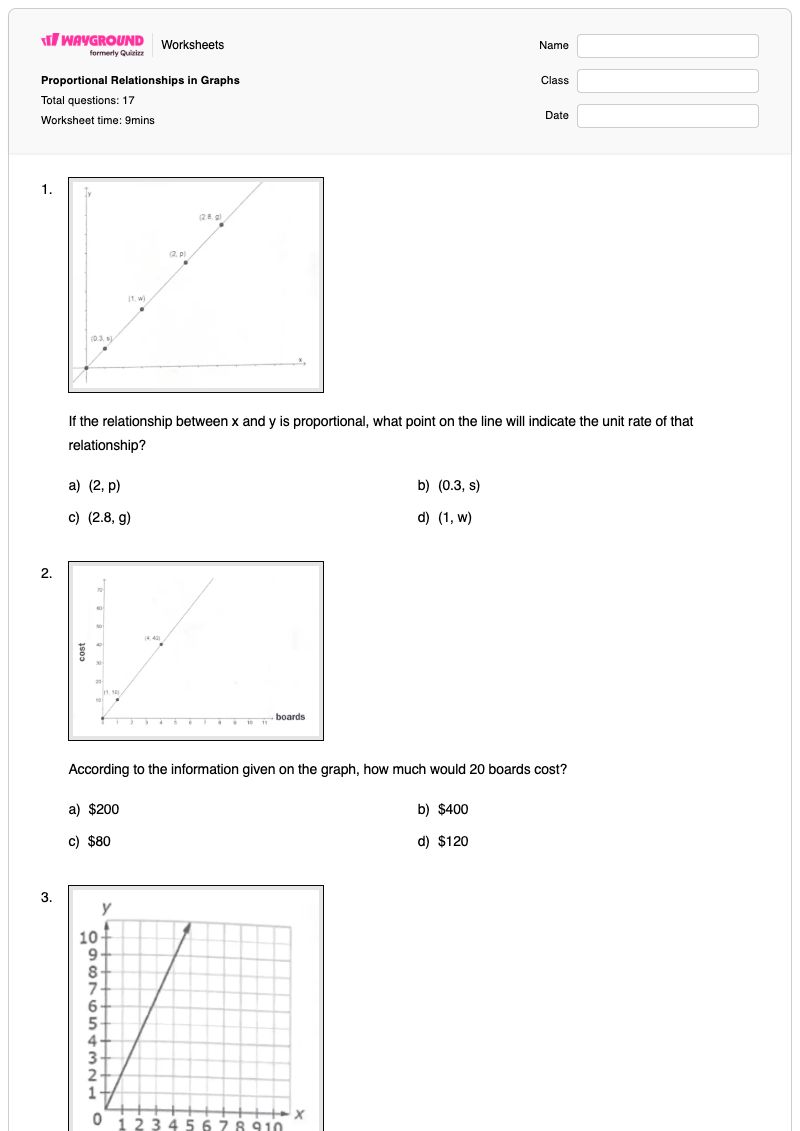
แบบฝึกหัดคณิตศาสตร์ระดับชั้น ม.1 เรื่องความสัมพันธ์แบบสัดส่วนในกราฟ ช่วยให้นักเรียนตีความและวิเคราะห์ความสัมพันธ์แบบสัดส่วนที่แสดงบนกราฟพิกัด แบบฝึกหัดนี้ประกอบด้วย 17 ข้อ ทั้งแบบเลือกตอบ เลือกคำตอบที่ถูกต้อง และแบบปลายเปิด ช่วยให้นักเรียนระบุอัตราต่อหน่วย กำหนดค่าคงที่ของสัดส่วน ตีความจุดบนกราฟ และตัดสินใจว่ากราฟนั้นแสดงความสัมพันธ์แบบสัดส่วนหรือไม่ นักเรียนจะได้ประยุกต์ใช้หลักฐานจากกราฟกับสถานการณ์ในชีวิตจริง เช่น ค่าใช้จ่าย เงินออม เวลาเรียน ผ้า การเดินทาง การซื้ออาหาร และถังเก็บน้ำ คำถามแบบปลายเปิดให้นักเรียนคำนวณปริมาณและอธิบายเหตุผลโดยใช้คุณสมบัติของกราฟ ในขณะที่คำถามแบบเลือกตอบช่วยเสริมสร้างความเข้าใจเกี่ยวกับจุดอัตราต่อหน่วยและรูปแบบสัดส่วน แบบฝึกหัดนี้สามารถพิมพ์ได้ฟรี มีเฉลยคำตอบครบถ้วน และออกแบบมาสำหรับการสอนคณิตศาสตร์ระดับชั้น ม.1 การฝึกฝนแบบมีผู้แนะนำ การทำงานอิสระ หรือการประเมินผลระหว่างเรียน

การตั้งค่าแผ่นงาน

ขนาดตัวอักษร

S
M
L
XL
Waygroundแผ่นงาน

Proportional Relationships in Graphs

คำถามทั้งหมด: 17

ชื่อ
ระดับ
วันที่
1.
If the relationship between x and y is proportional, what point on the line will indicate the unit rate of that relationship?

If the relationship between x and y is proportional, what point on the line will indicate the unit rate of that relationship?

a)

(2, p)

b)

(0.3, s)

c)

(2.8, g)

d)

(1, w)

2.
According to the information given on the graph, how much would 20 boards cost?

According to the information given on the graph, how much would 20 boards cost?

a)

$200

b)

$400

c)

$80

d)

$120

3.
Does the graph represent a proportional relationship? Make sure to explain your answer

Does the graph represent a proportional relationship? Make sure to explain your answer

4 เส้น
4.
What do the points on the graph mean? Select all the correct answers.

What do the points on the graph mean? Select all the correct answers.

a)

After 2 weeks, you have saved $94

b)

After 94 weeks, you have saved $2

c)

After 10 weeks, you save $94

d)

After 4 weeks, you have saved $188

e)

After 0 weeks, you have save $10

5.
According to the graph, what is the constant of proportionality?

According to the graph, what is the constant of proportionality?

a)

35\frac{3}{5}  

b)

5

c)

3

d)

13\frac{1}{3}  

6.
What is the unit rate for the number of hours of study each week per class?

What is the unit rate for the number of hours of study each week per class?

a)

25 hours

b)

5 hours

c)

7 hours

d)

10 hours

7.

Which graph show a line with C.O.P of 34\frac{3}{4}  

a)
Which graph show a line with C.O.P of
b)
Which graph show a line with C.O.P of
c)
Which graph show a line with C.O.P of
d)
Which graph show a line with C.O.P of
8.
What is the constant of proportionality of the graph? Explain how you know.

What is the constant of proportionality of the graph? Explain how you know.

4 เส้น
9.
The graph shows the cost of oranges per bag. What is the cost of 4 bags of oranges?

The graph shows the cost of oranges per bag. What is the cost of 4 bags of oranges?

4 เส้น
10.
Samir believes this graph is proportional and that the C.O.P is 3. Do you agree with the Samir. Explain why or why not.

Samir believes this graph is proportional and that the C.O.P is 3. Do you agree with the Samir. Explain why or why not.

4 เส้น
11.
Angela uses this graph to purchase potatoes for her restaurant. How many pounds of potatoes is she able to purchase with $30?

Angela uses this graph to purchase potatoes for her restaurant. How many pounds of potatoes is she able to purchase with $30?

4 เส้น
12.
Maya uses blue and orange fabric to make identical wall decorations. The graph below shows the relationship between the…

Maya uses blue and orange fabric to make identical wall decorations. The graph below shows the relationship between the amounts of blue and orange fabric used. What is the constant of proportionality as shown in the graph?

a)

310\frac{3}{10}  

b)

25\frac{2}{5}  

c)

37\frac{3}{7}  

d)

12\frac{1}{2}  

13.
The graph shows the relationship between x, the amount of time in hours, and y, the distance traveled in miles, by a probe…

The graph shows the relationship between x, the amount of time in hours, and y, the distance traveled in miles, by a probe before it reaches Mars. Does the graph represent a proportional relationship? Why or Why Not. Then Determine the number of miles the probe travels in 5.5 hours.

4 เส้น
14.
The line graphed below show the amount of water in two tanks as they are being filled over time. For each tank, explain…

The line graphed below show the amount of water in two tanks as they are being filled over time. For each tank, explain whether or not there is a proportional relationship between the amount of water, in gallons, and the time, in minutes. If there is a proportional relationship, identify the unit rate. Be sure to use specific features of the graph to support your answer.

4 เส้น
15.
The graph below shows the relationship between the number of people in a group and the total cost of admission tickets for a…

The graph below shows the relationship between the number of people in a group and the total cost of admission tickets for a circus. Which point on the graph represents the unit rate?

a)

(0,0)

b)

(1, 15)

c)

(15, 1)

d)

(8, 120)

16.
A grocery store sells sliced turkey. The graph shows the relationship between the weight of the sliced turkey and the total…

A grocery store sells sliced turkey. The graph shows the relationship between the weight of the sliced turkey and the total cost of the sliced turkey. Two points, R and W, are laced on the graph shows below. Which statement about the graph is true?

a)

Point R means that the unit rate is $10.00 per pound

b)

Point R means that the unit rate is 4 pounds per dollar.

c)

Point W means that the unit rate is $2.50 per pound.

d)

Point W means that the unit rate is 2.5 pounds per dollar

17.
The graph below shows the total distance, in miles, traveled by a towboat over time, in hours. Which statement BESTS…

The graph below shows the total distance, in miles, traveled by a towboat over time, in hours. Which statement BESTS described the meaning of the coordinates of point F on the graph.

a)

It shows the unit rate of the graph in hours per mile.

b)

It shows the unit rate of the graph in miles per hour.

c)

It shows the time, in hours, it takes the towboat to travel 1 mile

d)

It shows the distance traveled, in miles, by the towboat after 5.25 hours.

Waygroundแป้นคำตอบ

Proportional Relationships in Graphs

คำถามทั้งหมด: 17

1.
d)

(1, w)

2.
a)

$200

3.
ไม่มี
4.
a)

After 2 weeks, you have saved $94

, d)

After 4 weeks, you have saved $188

5.
a)

35\frac{3}{5}  

6.
b)

5 hours

7.
d)
8.
ไม่มี
9.
ไม่มี
10.
ไม่มี
11.
ไม่มี
12.
c)

37\frac{3}{7}  

13.
ไม่มี
14.
ไม่มี
15.
b)

(1, 15)

16.
c)

Point W means that the unit rate is $2.50 per pound.

17.
b)

It shows the unit rate of the graph in miles per hour.

คำถามที่พบบ่อย

แบบฝึกหัดเรื่องความสัมพันธ์แบบสัดส่วนในกราฟ ครอบคลุมหัวข้ออะไรบ้าง?

แบบฝึกหัดคณิตศาสตร์ชั้น ม.1 นี้เน้นการตีความความสัมพันธ์แบบสัดส่วนจากกราฟ รวมถึงการระบุจุดอัตราต่อหน่วย การหาค่าคงที่ของสัดส่วน การตีความจุดที่พล็อต และการพิจารณาว่ากราฟแสดงถึงความสัมพันธ์แบบสัดส่วนหรือไม่ แบบฝึกหัดนี้มีคำถามแบบผสมผสาน 17 ข้อ ที่ให้นักเรียนเลือกคำตอบ เลือกการตีความกราฟได้หลายแบบ คำนวณค่าในบริบทของโลกแห่งความเป็นจริง และอธิบายข้อสรุปโดยใช้หลักฐานจากกราฟ

ฉันจะใช้แบบฝึกหัดนี้สอนเรื่องความสัมพันธ์แบบสัดส่วนจากกราฟได้อย่างไร?

เริ่มต้นด้วยการทบทวนว่าจุดที่มีค่า x เท่ากับ 1 แสดงถึงอัตราต่อหน่วยอย่างไร และค่าคงที่ของสัดส่วนเชื่อมโยง x และ y อย่างไร จากนั้นให้ยกตัวอย่างต้นทุนหรือการประหยัดโดยใช้กราฟหนึ่งตัวอย่าง ก่อนให้นักเรียนทำแบบฝึกหัดแบบเลือกตอบและคำถามปลายเปิดที่ต้องอธิบาย ใช้คำถามเกี่ยวกับเครื่องมือวัด ถังเก็บน้ำ และการซื้อสินค้า เพื่ออภิปรายว่านักเรียนสามารถอธิบายความสัมพันธ์ของสัดส่วนและคำนวณปริมาณที่ไม่ทราบค่าจากกราฟได้อย่างไร

ฉันควรระวังข้อผิดพลาดอะไรบ้างเมื่อนักเรียนทำแบบฝึกหัดการวาดกราฟนี้?

นักเรียนอาจสลับพิกัดเมื่อตีความจุด สับสนจุดอัตราต่อหน่วยกับจุดกำเนิด หรือคำนวณค่าคงที่ของสัดส่วนโดยใช้สัดส่วนที่ไม่ถูกต้อง ในข้อสอบแบบเลือกตอบหลายข้อ นักเรียนอาจเลือกข้อความที่สลับค่าสัปดาห์และค่าเงินออม สำหรับคำถามปลายเปิด ให้ตรวจสอบว่านักเรียนสนับสนุนการตัดสินใจเรื่องสัดส่วนด้วยคุณลักษณะของกราฟ แทนที่จะตอบเพียงแค่ใช่หรือไม่ใช่ และใช้หน่วยที่ถูกต้องเมื่อแก้ปัญหาตามบริบท

ฉันจะมอบหมายและให้คะแนนแบบฝึกหัดเรื่องความสัมพันธ์เชิงสัดส่วนนี้ได้อย่างไร?

คุณสามารถมอบหมายงานเรื่องความสัมพันธ์เชิงสัดส่วนในกราฟได้ในรูปแบบไฟล์ PDF ที่พิมพ์ได้ หรือเป็นแบบทดสอบดิจิทัลบน Wayground แบบฝึกหัดนี้มีเฉลยคำตอบครบถ้วนสำหรับคำถามแบบเลือกตอบ คำถามแบบเลือกหลายข้อ และคำถามปลายเปิด และสามารถตรวจงานของนักเรียนได้โดยการสแกนงานของนักเรียนด้วยแอป Wayground for Teachers รูปแบบที่พิมพ์ได้ยังช่วยสนับสนุนห้องเรียนที่ลดเวลาการใช้หน้าจอได้อีกด้วย

ฉันจะปรับแบบฝึกหัดเรื่องความสัมพันธ์แบบสัดส่วนนี้ให้เหมาะสมกับนักเรียนของฉันได้อย่างไร?

ใช้การตั้งค่าขั้นสูงของแบบฝึกหัดเพื่อปรับระยะห่างระหว่างตัวอักษรและขนาดตัวอักษร เพื่อให้ป้ายกำกับกราฟ ตัวเลือกคำตอบ และคำอธิบายอ่านง่ายขึ้น นอกจากนี้ คุณยังสามารถใช้แบบอักษรที่เหมาะสำหรับผู้ที่มีภาวะดิสเล็กเซีย หรือแปลแบบฝึกหัดเป็นภาษาอื่น เพื่อช่วยให้นักเรียนเข้าถึงการตีความกราฟและปัญหาความสัดส่วนในโลกแห่งความเป็นจริงในรูปแบบที่เหมาะสมกับความต้องการของพวกเขา

ฉันจะหาแบบฝึกหัดแบบนี้เพิ่มเติมได้ที่ไหนบน Wayground?

Wayground นำเสนอชุดแบบฝึกหัดและโจทย์ฝึกหัดฟรีที่ครอบคลุมหลากหลายวิชา พร้อมไฟล์ PDF และเฉลยคำตอบ เพื่อช่วยให้นักเรียนเชี่ยวชาญทักษะและแนวคิดที่สำคัญ ดูแหล่งข้อมูลเพิ่มเติมได้ที่ https://wayground.com/en-us/worksheets