

Wayground
Coordinate Graphing - Printable คณิตศาสตร์ Worksheets 5th ระดับชั้น - Wayground

Coordinate Graphing

Paige Mayo

สร้างโดย Paige Mayo

12 คำถาม

5th ระดับชั้น

คณิตศาสตร์

อัปเดตแล้ว ต.ค. 2569

แบบฝึกหัดการเขียนกราฟพิกัด เป็นแบบฝึกหัดคณิตศาสตร์สำหรับชั้นประถมศึกษาปีที่ 5 ประกอบด้วยคำถามแบบเลือกตอบ 12 ข้อ เกี่ยวกับการอ่านและการใช้ตารางพิกัด นักเรียนจะได้ระบุจุดกำเนิด แยกแยะแกน x จากแกน y ตีความลำดับของพิกัด และติดตามการเคลื่อนที่ในแนวนอนและแนวตั้งเพื่อลงจุด เช่น (5, 3) และ (3, 0) นอกจากนี้ พวกเขายังอ่านตารางพิกัดและกราฟ ระบุจุดยอดที่หายไปในรูปสี่เหลี่ยมคางหมู สี่เหลี่ยมขนมเปียกปูน และสี่เหลี่ยมด้านขนาน และวิเคราะห์ว่าความสัมพันธ์เป็นไปตามรูปแบบการบวกหรือการคูณ แบบฝึกหัดนี้ช่วยให้นักเรียนได้ฝึกฝนการเชื่อมโยงคู่ลำดับ จุดที่ลงจุด ตาราง และรูปทรงเรขาคณิตอย่างมีประสิทธิภาพ ช่วยให้ครูตรวจสอบว่านักเรียนสามารถใช้หลักการพิกัดได้อย่างถูกต้องและอธิบายรูปแบบโดยการเปรียบเทียบค่า x และ y ที่สอดคล้องกันได้หรือไม่ แบบฝึกหัดที่พิมพ์ได้ฟรีนี้มีเฉลยคำตอบ ทำให้เหมาะสำหรับการฝึกฝนด้วยตนเอง การทบทวน หรือการประเมินในชั้นเรียน

การตั้งค่าแผ่นงาน

ขนาดตัวอักษร

S
M
L
XL
Waygroundแผ่นงาน

Coordinate Graphing

คำถามทั้งหมด: 12

ชื่อ
ระดับ
วันที่
1.
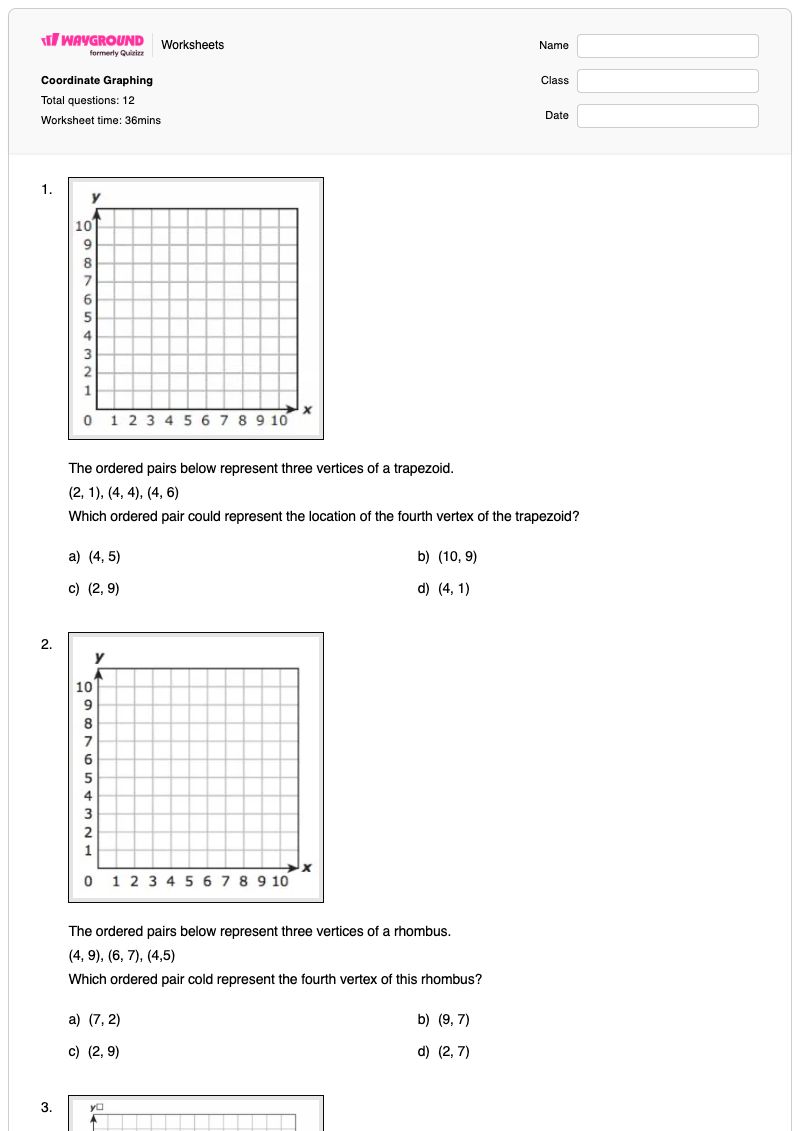
The ordered pairs below represent three vertices of a trapezoid. (2, 1), (4, 4), (4, 6) Which ordered pair could represent…

The ordered pairs below represent three vertices of a trapezoid.

(2, 1), (4, 4), (4, 6)

Which ordered pair could represent the location of the fourth vertex of the trapezoid?

a)

(4, 5)

b)

(10, 9)

c)

(2, 9)

d)

(4, 1)

2.
The ordered pairs below represent three vertices of a rhombus. (4, 9), (6, 7), (4,5) Which ordered pair cold represent the…

The ordered pairs below represent three vertices of a rhombus.

(4, 9), (6, 7), (4,5)

Which ordered pair cold represent the fourth vertex of this rhombus?

a)

(7, 2)

b)

(9, 7)

c)

(2, 9)

d)

(2, 7)

3.
Three points are plotted on the coordinate grid. Which table represents the data plotted in the graph?

Three points are plotted on the coordinate grid.

Which table represents the data plotted in the graph?

a)
Three points are plotted on the coordinate grid. Which table represents the data plotted in the graph?
b)
Three points are plotted on the coordinate grid. Which table represents the data plotted in the graph?
c)
Three points are plotted on the coordinate grid. Which table represents the data plotted in the graph?
d)
Three points are plotted on the coordinate grid. Which table represents the data plotted in the graph?
4.
The graph shows three of the four vertices of parallelogram VWXY. At which location on the coordinate grid could point Y be…

The graph shows three of the four vertices of parallelogram VWXY.

At which location on the coordinate grid could point Y be located?

a)

(1.5, 6.5)

b)

(6.5, 2)

c)

(6.5, 1.5)

d)

(2, 6.5)

5.

A student will graph the point (5, 3) on a coordinate grid. Which steps can the student take in order to graph the point correctly?

a)

Start at the origin. Move 5 units up. Move 3 units right. Graph the point.

b)

Start at the origin. Move 5 units right. Move 3 units right. Graph the point.

c)

Start at the origin. Move 5 units up. Move 3 units up. Graph the point.

d)

Start at the origin. Move 5 units right. Move 3 units up. Graph the point.

6.

Yvonne is using a coordinate grid for the first time. She wants to find the location of the ordered pair (3, 7) on the grid.

Starting at the origin, which movement should Yvonne do first?

a)

Move right along the x-axis to 3

b)

Move up along the y-axis to 3

c)

Move right along the y-axis to 7

d)

Move up along the x-axis to 7

7.

A student graphs a point that is represented by the ordered pair (3, 0). In this ordered pair, what does the number 3 indicate?

a)

The point is 3 units above 0 on the x-axis

b)

The point is 3 units above 0 on the y-axis

c)

The point is 3 units to the right of 0 on the y-axis

d)

The point is 3 units to the right of 0 on the x-axis

8.

What are the coordinates of the point where the x-axis and the y-axis intersect on a coordinate plane?

a)

(5, 5)

b)

(5, 0)

c)

(0, 5)

d)

(0, 0)

9.

Which statement is NOT true about a coordinate grid?

a)

The vertical number line is the y-axis

b)

In a coordinate grid, the x-axis and the y-axis are perpendicular to each other.

c)

The x-coordinate is the second number in an ordered pair.

d)

The origin is the intersection of the x-axis and the y-axis

10.
The points on the graph represent a numerical pattern. Which statement about the pattern represented on the graph is true?

The points on the graph represent a numerical pattern. Which statement about the pattern represented on the graph is true?

a)

It is a multiplicative pattern because each y-coordinate has a higher value than the corresponding x-coordinate

b)

It is a multiplicative pattern because each x-coordinate is multiplied by 5 to create the corresponding y-coordinate

c)

It is an additive pattern because each y-coordinate has a higher value than the corresponding x-coordinate

d)

It is an additive pattern because each x-coordinate is increased by 4 to create the corresponding y-coordinate

11.
The table represents a relationship between x and y. The relationship between x-values and y-values creates a pattern that…

The table represents a relationship between x and y.

The relationship between x-values and y-values creates a pattern that is -

a)

additive, because each x-value increases by 5

b)

additive, because each y-value is determine by adding 17 to the corresponding x-value

c)

multiplicative, because each y-value is determine by multiplying the corresponding x-value by 17

d)

multiplicative, because each x-value is a multiple of 5

12.
The table shows x-values and y-values for a number pattern. Which statement is true?

The table shows x-values and y-values for a number pattern.

Which statement is true?

a)

The pattern is multiplicative, because the y-values are 1.5 times the corresponding x-values.

b)

The pattern is multiplicative, because the y-values are 6 more than the corresponding x-values

c)

The pattern is additive, because the y-values are 1.5 times the corresponding x-values.

d)

The pattern is additive, because the y-values are 6 more than the corresponding x-values

Waygroundแป้นคำตอบ

Coordinate Graphing

คำถามทั้งหมด: 12

1.
c)

(2, 9)

2.
d)

(2, 7)

3.
a)
4.
c)

(6.5, 1.5)

5.
d)

Start at the origin. Move 5 units right. Move 3 units up. Graph the point.

6.
a)

Move right along the x-axis to 3

7.
d)

The point is 3 units to the right of 0 on the x-axis

8.
d)

(0, 0)

9.
c)

The x-coordinate is the second number in an ordered pair.

10.
d)

It is an additive pattern because each x-coordinate is increased by 4 to create the corresponding y-coordinate

11.
b)

additive, because each y-value is determine by adding 17 to the corresponding x-value

12.
d)

The pattern is additive, because the y-values are 6 more than the corresponding x-values

คำถามที่พบบ่อย

แบบฝึกหัดการเขียนกราฟพิกัดครอบคลุมหัวข้ออะไรบ้าง?

แบบฝึกหัดคณิตศาสตร์ชั้นประถมศึกษาปีที่ 5 นี้ประกอบด้วยคำถามแบบเลือกตอบ 12 ข้อ เพื่อฝึกฝนการอ่านและการลงจุดพิกัด การระบุจุดกำเนิดและแกน และการตีความตารางพิกัดและกราฟ นักเรียนยังใช้พิกัดเพื่อหาจุดยอดที่สี่ที่เป็นไปได้ของรูปสี่เหลี่ยมคางหมู รูปสี่เหลี่ยมขนมเปียกปูน และรูปสี่เหลี่ยมด้านขนาน และจำแนกความสัมพันธ์ว่าเป็นแบบบวกหรือแบบคูณ

ฉันจะใช้แบบฝึกหัดการวาดกราฟพิกัดนี้เพื่อสอนเรื่องคู่ลำดับและรูปแบบได้อย่างไร?

แนะนำระนาบพิกัดโดยให้นักเรียนระบุจุดกำเนิด แกน x และแกน y จากนั้นสาธิตการเคลื่อนที่แบบ “x ก่อน y ทีหลัง” สำหรับจุดเช่น (5, 3) หลังจากที่นักเรียนทำแบบฝึกหัดการลงจุดและรูปสี่เหลี่ยมเสร็จแล้ว ให้ใช้คำถามเกี่ยวกับตารางและกราฟเพื่ออภิปรายว่าการเปรียบเทียบค่าที่สอดคล้องกันเผยให้เห็นรูปแบบการบวกหรือการคูณอย่างไร

ฉันควรระวังข้อผิดพลาดอะไรบ้างเมื่อนักเรียนทำแบบฝึกหัดการวาดกราฟพิกัดนี้?

สังเกตดูว่านักเรียนสลับพิกัด x และ y หรือไม่ เคลื่อนที่ไปตามแกนผิด หรือเริ่มต้นจากตำแหน่งอื่นที่ไม่ใช่จุดกำเนิดเมื่อวาดจุดหรือไม่ นักเรียนอาจเลือกจุดยอดที่สี่โดยไม่ตรวจสอบรูปทรง หรือสับสนระหว่างความสัมพันธ์แบบบวก เช่น การเพิ่มค่าคงที่ให้กับค่า x แต่ละค่า กับความสัมพันธ์แบบคูณหรือไม่

ฉันจะมอบหมายและให้คะแนนแบบฝึกหัดการเขียนกราฟพิกัดนี้ได้อย่างไร?

แบบฝึกหัดนี้มีให้ดาวน์โหลดเป็นไฟล์ PDF สำหรับพิมพ์ และเป็นแบบทดสอบดิจิทัลบน Wayground โดยมีเฉลยคำตอบครบถ้วนสำหรับคำถามแบบเลือกตอบทั้ง 12 ข้อ สำหรับการส่งงานแบบพิมพ์ คุณสามารถสแกนงานของนักเรียนด้วยแอป Wayground for Teachers เพื่อใช้ในการตรวจให้คะแนนได้

ฉันจะปรับแบบฝึกหัดการวาดกราฟพิกัดนี้ให้เหมาะสมกับนักเรียนของฉันได้อย่างไร?

ใช้การตั้งค่าขั้นสูงของแบบฝึกหัดเพื่อปรับระยะห่างระหว่างตัวอักษรหรือขนาดตัวอักษร เพื่อให้คำถามเกี่ยวกับตารางพิกัดและตัวเลือกคำตอบอ่านง่ายขึ้น นอกจากนี้ คุณยังสามารถใช้แบบอักษรที่เหมาะสำหรับผู้ที่มีภาวะดิสเล็กเซีย หรือแปลแบบฝึกหัดเป็นภาษาอื่นในขณะที่นักเรียนกำลังทำแบบฝึกหัดเกี่ยวกับคู่ลำดับ กราฟ และตารางได้

ฉันจะหาแบบฝึกหัดแบบนี้เพิ่มเติมได้ที่ไหนบน Wayground?

Wayground มีแบบฝึกหัดและโจทย์ฝึกหัดมากมายให้ดาวน์โหลดฟรีในหลากหลายวิชา พร้อมไฟล์ PDF และเฉลยคำตอบ เพื่อช่วยให้นักเรียนพัฒนาทักษะและความเข้าใจในแนวคิดสำคัญๆ ดูแหล่งข้อมูลเพิ่มเติมได้ที่ https://wayground.com/en-us/worksheets