Wayground
Two Way Tables - Printable คณิตศาสตร์ Worksheets ระดับ 8 - Wayground

Two Way Tables

Charlette Ezenwanne

สร้างโดย Charlette Ezenwanne

20 คำถาม

8th ระดับชั้น

คณิตศาสตร์

อัปเดตแล้ว ต.ค. 2569

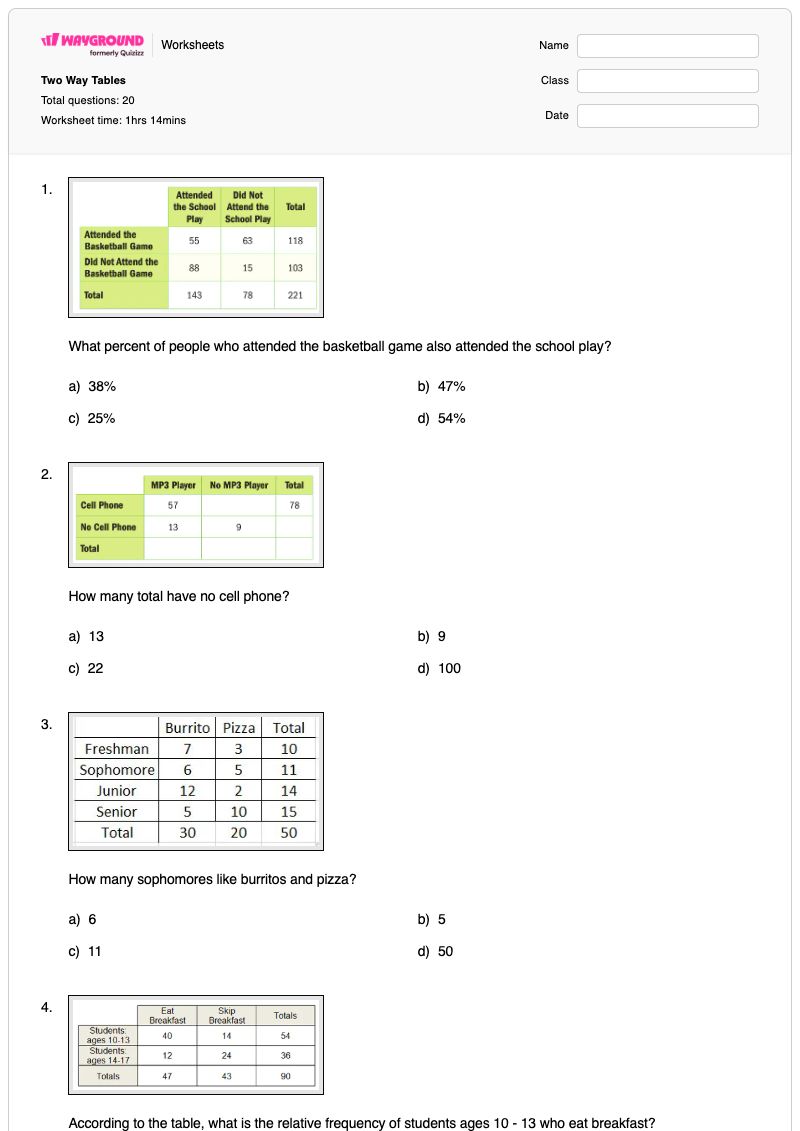
แบบฝึกหัดคณิตศาสตร์ระดับชั้น ม.2 นี้ ช่วยให้นักเรียนได้ฝึกฝนการตีความตารางสองมิติอย่างมีประสิทธิภาพ ประกอบด้วย 20 ข้อ—19 ข้อเป็นคำถามแบบเลือกตอบ และ 1 ข้อเป็นคำถามแบบเติมคำในช่องว่าง—นักเรียนจะได้ระบุความถี่ คำนวณผลรวมทั้งหมดและผลรวมของแต่ละหมวดหมู่ หาค่าที่หายไป และกำหนดความถี่สัมพัทธ์และร้อยละจากข้อมูลในตาราง นอกจากนี้ยังสามารถประเมินข้อสรุปจากการสำรวจและตีความความสัมพันธ์ระหว่างตัวแปรเชิงหมวดหมู่สองตัวได้อีกด้วย แบบฝึกหัดนี้ใช้บริบทในชีวิตประจำวัน เช่น ความชอบกีฬา กิจกรรมในโรงเรียน การซื้ออาหารและเครื่องดื่ม ระดับการศึกษา นิสัยการรับประทานอาหารเช้า พยากรณ์อากาศ และความชอบในแต่ละระดับชั้น ออกแบบมาเพื่อใช้ในการสอนการอ่านและวิเคราะห์ตารางสองมิติ การตรวจสอบว่าร้อยละที่คำนวณได้นั้นถูกต้องหรือไม่ และการอธิบายว่าข้อมูลแสดงอะไร แบบฝึกหัดที่พิมพ์ได้ฟรีนี้มีเฉลยคำตอบครบถ้วนสำหรับการทบทวนอย่างมีประสิทธิภาพ การฝึกฝนด้วยตนเอง การบ้าน หรือการประเมินผลระหว่างเรียน

การตั้งค่าแผ่นงาน

ขนาดตัวอักษร

S
M
L
XL
Waygroundแผ่นงาน

Two Way Tables

คำถามทั้งหมด: 20

ชื่อ
ระดับ
วันที่
1.
What percent of people who attended the basketball game also attended the school play?

What percent of people who attended the basketball game also attended the school play?

a)

38%

b)

47%

c)

25%

d)

54%

2.
How many total have no cell phone?

How many total have no cell phone?

a)

13

b)

9

c)

22

d)

100

3.
How many sophomores like burritos and pizza?
a)
6
b)
5
c)
11
d)
50
4.
According to the table, what is the relative frequency of students ages 10 - 13 who eat breakfast?
a)
About 33%
b)
About 50%
c)
About 40%
d)
About 44%
5.
What percent of all students were females who prefer football?

What percent of all students were females who prefer football?

a)

16%

b)

80%

c)

8%

d)

12%

6.
A survey was given to decide what sport males & females prefer to watch on TV. What is the GRAND TOTAL of people that were…

A survey was given to decide what sport males & females prefer to watch on TV. What is the GRAND TOTAL of people that were surveyed?

a)

48

b)

52

c)

100

d)

36

7.
How many males were surveyed?

How many males were surveyed?

a)

77

b)

15

c)

150

d)

52

8.
A survey explored the relationship between gender and band class. Which is a reasonable conclusion?
a)
There are more band members than non-band members
b)
There are more boys in the class than girls
c)
There are more boys in band than not in band
d)
More than half of the bands members in the class are girls
9.
How many Males have Masters/Doctoral Degree?

How many Males have Masters/Doctoral Degree?

a)

16

b)

3

c)

46

d)

62

10.
How many Bachelor's Degrees were given?

How many Bachelor's Degrees were given?

a)

46

b)

51

c)

97

d)

5

11.

Two way tables show us the (a)   or number of times something occurs.

12.
True or false: Both 8th and 9th grade participants preferred winter the least.

True or false:

Both 8th and 9th grade participants preferred winter the least.

a)

true

b)

false

13.
How many people purchased no food and no drink?
a)
60
b)
10
c)
20
d)
200
14.
What number should go in the blue box?

What number should go in the blue box?

a)

21

b)

135

c)

19

d)

22

15.
What percentage of the days that it rained, did they forecast no rain?
a)
About 20%
b)
About 18%
c)
About 14%
d)
About 12%
16.
How many chemical engineers chose Science as their favorite subject?
a)
80
b)
91
c)
171
d)
262
17.
How many males were surveyed?

How many males were surveyed?

a)

77

b)

15

c)

150

d)

52

18.
How many total people were surveyed about what ice cream flavor they would pick?
a)
107
b)
92
c)
70
d)
269
19.
What percentage of the students have brown hair?
a)
25%
b)
60%
c)
45%
d)
50%
20.
What percentage of SUV's are driven by women?
a)
56.25%
b)
75%
c)
83.25%
d)
86.5%
Waygroundแป้นคำตอบ

Two Way Tables

คำถามทั้งหมด: 20

1.
b)

47%

2.
c)

22

3.
c) 11
4.
d) About 44%
5.
c)

8%

6.
c)

100

7.
a)

77

8.
d) More than half of the bands members in the class are girls
9.
b)

3

10.
c)

97

11.
frequency
12.
a)

true

13.
b) 10
14.
a)

21

15.
c) About 14%
16.
b) 91
17.
a)

77

18.
d) 269
19.
c) 45%
20.
d) 86.5%

คำถามที่พบบ่อย

แบบฝึกหัดตารางสองมิติชุดนี้ครอบคลุมเรื่องอะไรบ้าง?

แบบฝึกหัดสำหรับนักเรียนชั้น ม.2 นี้ช่วยพัฒนาทักษะการตีความตารางสองมิติผ่านคำถาม 20 ข้อ: 19 ข้อเป็นแบบเลือกตอบ และ 1 ข้อเป็นแบบเติมคำในช่องว่าง นักเรียนจะได้หาผลรวมของแถว คอลัมน์ และผลรวมทั้งหมด ระบุความถี่และค่าที่หายไป คำนวณร้อยละและความถี่สัมพัทธ์ และตัดสินว่าข้อสรุปเกี่ยวกับข้อมูลจากการสำรวจนั้นได้รับการสนับสนุนจากตารางหรือไม่

ฉันจะใช้แบบฝึกหัดนี้สอนนักเรียนเกี่ยวกับการตีความตารางสองมิติได้อย่างไร?

เริ่มด้วยการสาธิตวิธีการหาเซลล์ จากนั้นบวกค่าในแถวและคอลัมน์เพื่อหาผลรวม ก่อนที่จะคำนวณเปอร์เซ็นต์หรือความถี่สัมพัทธ์ ใช้แบบสอบถามเกี่ยวกับกีฬา เพศ การเข้าร่วมวงดนตรี และระดับปริญญา เพื่อกระตุ้นให้นักเรียนระบุตัวหารที่พวกเขาใช้ และอธิบายความหมายของข้อสรุปในบริบท หลังจากตัวอย่างประกอบแล้ว ให้มอบหมายข้อสอบแบบเลือกตอบและคำถามเติมคำในช่องว่างเกี่ยวกับความถี่ที่เหลือให้นักเรียนฝึกฝนด้วยตนเอง

ฉันควรระวังข้อผิดพลาดอะไรบ้างเมื่อนักเรียนทำแบบฝึกหัดตารางสองมิติชุดนี้?

ระวังนักเรียนที่ใช้ผลรวมของแถวหรือหมวดหมู่เมื่อคำถามถามถึงเปอร์เซ็นต์ของนักเรียนทั้งหมด เช่น ข้อที่เกี่ยวกับนักเรียนหญิงที่ชอบฟุตบอล นักเรียนอาจสับสนระหว่างจำนวนนับในเซลล์กับผลรวมของแถว คอลัมน์ หรือผลรวมทั้งหมด หรือเลือกข้อสรุปที่กลับด้านกับการเปรียบเทียบที่แสดงในตาราง สำหรับคำถามเกี่ยวกับความถี่สัมพัทธ์ ให้พวกเขาระบุทั้งกลุ่มย่อยที่เกี่ยวข้องและจำนวนข้อมูลทั้งหมดก่อนทำการคำนวณ

ฉันจะมอบหมายและให้คะแนนแบบฝึกหัดตารางสองมิตินี้อย่างไร?

แบบฝึกหัดนี้มีให้ดาวน์โหลดในรูปแบบ PDF และแบบทดสอบดิจิทัลบน Wayground พร้อมเฉลยคำตอบครบถ้วน สามารถมอบหมายแบบทดสอบดิจิทัลเพื่อตรวจคำตอบโดยอัตโนมัติ หรือพิมพ์ออกมาเพื่อฝึกเขียนและตรวจคำตอบของนักเรียนโดยใช้เฉลย นอกจากนี้ คุณยังสามารถสแกนงานของนักเรียนที่พิมพ์ได้ด้วยแอป Wayground for Teachers

ฉันจะหาความแตกต่างในแบบฝึกหัดตารางสองมิตินี้ได้อย่างไร?

ในการตั้งค่าขั้นสูงของแบบฝึกหัด ให้ปรับระยะห่างระหว่างตัวอักษรหรือเลือกขนาดตัวอักษรที่ใหญ่ขึ้นเพื่อให้ตารางสองมิติ ตัวเลือกคำตอบ และคำถามเกี่ยวกับเปอร์เซ็นต์อ่านง่ายขึ้น นอกจากนี้ คุณยังสามารถเปิดใช้งานแบบอักษรที่เหมาะสำหรับผู้ที่มีภาวะดิสเล็กเซีย หรือแปลแบบฝึกหัดเป็นภาษาอื่นหากภาษานั้นรองรับการเข้าถึงคำถามแบบตารางได้

ฉันจะหาแบบฝึกหัดฟรีแบบนี้เพิ่มเติมได้ที่ไหนบน Wayground?

Wayground มีแบบฝึกหัดและโจทย์ฝึกหัดมากมายให้ดาวน์โหลดฟรีในหลากหลายวิชา พร้อมไฟล์ PDF และเฉลยคำตอบ เพื่อช่วยให้นักเรียนพัฒนาทักษะและความเข้าใจในแนวคิดสำคัญๆ ดูแหล่งข้อมูลเพิ่มเติมได้ที่ https://wayground.com/en-us/worksheets
