

Wayground
AP Stats Chapter 3 Vocabulary - Printable คณิตศาสตร์ Worksheets ระดับ 12 - Wayground

AP Stats Chapter 3 Vocabulary

Christina Hightower

สร้างโดย Christina Hightower

16 คำถาม

12th ระดับชั้น

คณิตศาสตร์

อัปเดตแล้ว ก.พ. 2569

แบบฝึกหัดคณิตศาสตร์ระดับชั้นมัธยมศึกษาปีที่ 6 บทที่ 3 วิชาสถิติ AP เน้นคำศัพท์และการตีความในเรื่องความสัมพันธ์และการถดถอยเชิงเส้น นักเรียนจะได้เรียงลำดับคำอธิบายความสัมพันธ์ จับคู่คำศัพท์สำคัญ เช่น สัมประสิทธิ์ความสัมพันธ์ สัมประสิทธิ์การกำหนดค่า ส่วนเหลือ ความชัน จุดตัดแกน y จุดอิทธิพล การประมาณค่าภายนอก และ LSRL กับความหมาย และแยกแยะความแตกต่างระหว่างความสัมพันธ์กับสาเหตุ แบบฝึกหัดนี้ยังตรวจสอบความสามารถของนักเรียนในการตีความ r และ r² ระบุประเภทของความสัมพันธ์จากกราฟ จดจำค่าที่แสดงถึงความสัมพันธ์เชิงบวกที่แข็งแกร่งหรือความสัมพันธ์เชิงลบที่อ่อนแอ ระบุสิ่งที่ปรากฏในแผนภาพส่วนเหลือ และเติมความหมายของส่วนเหลือโดยใช้ค่าจริงและค่าที่คาดการณ์ไว้ รูปแบบที่หลากหลายของแบบฝึกหัดประกอบด้วย การเรียงลำดับ การจับคู่ การเลือกแบบดรอปดาวน์ การเลือกหลายรายการ การเลือกคำตอบหลายข้อ และการเติมคำในช่องว่าง แบบฝึกหัดที่พิมพ์ได้ฟรีนี้มีเฉลยคำตอบที่สมบูรณ์เพื่อการทบทวน ตรวจสอบคำศัพท์ หรือการประเมินผลอย่างมีประสิทธิภาพ

การตั้งค่าแผ่นงาน

ขนาดตัวอักษร

S
M
L
XL
Waygroundแผ่นงาน

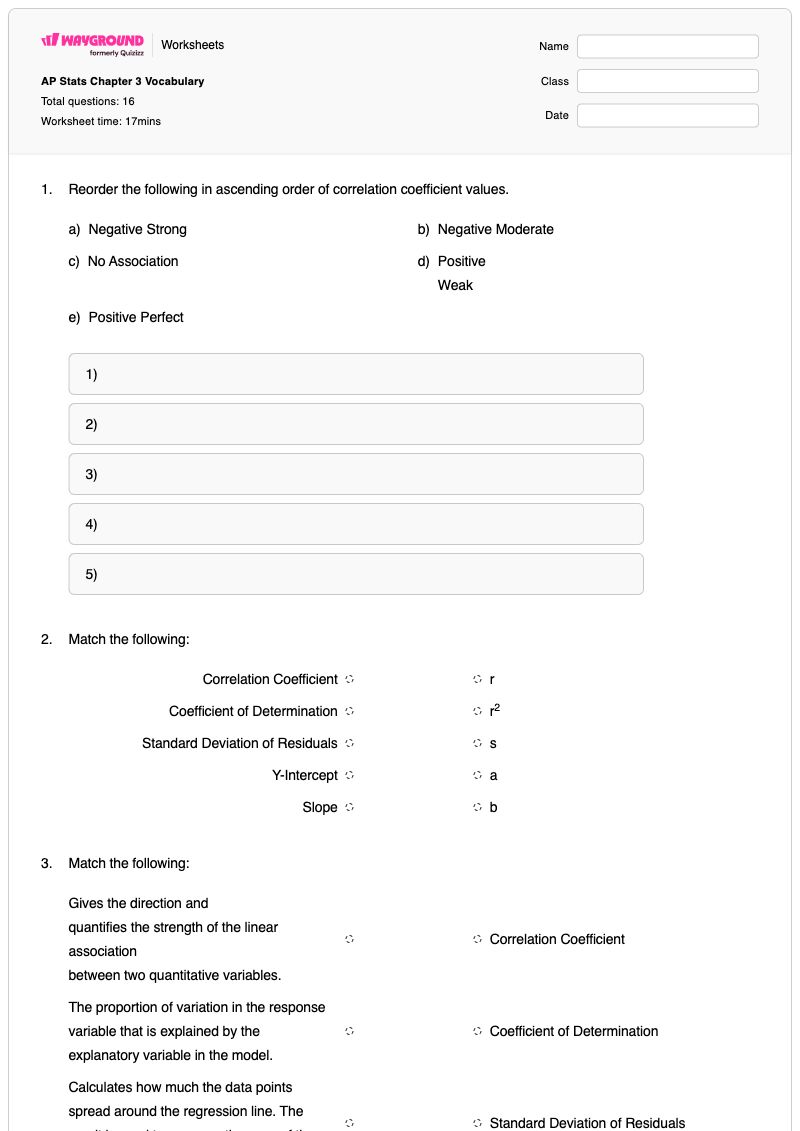
AP Stats Chapter 3 Vocabulary

คำถามทั้งหมด: 16

ชื่อ
ระดับ
วันที่
1.

Reorder the following in ascending order of correlation coefficient values.

a)

Negative Strong

b)

Negative Moderate

c)

No Association

d)

Positive

Weak

e)

Positive Perfect

1)
2)
3)
4)
5)
2.

Match the following:

Correlation Coefficient

r

Coefficient of Determination

r2

Standard Deviation of Residuals

s

Y-Intercept

a

Slope

b

3.

Match the following:

Gives the direction and

quantifies the strength of the linear association

between two quantitative variables.

Correlation Coefficient

The proportion of variation in the response variable that is explained by the

explanatory variable in the model.

Coefficient of Determination

Calculates how much the data points spread around the regression line. The result is used to measure the error of the regression line's predictability.

Standard Deviation of Residuals

The value of the dependent variable when x equals zero.

Y-Intercept

Change in the dependent variable divided by the change in the independent variable.

Slope

4.

As observational study can show ​ (a)   . When one variable has an association with another.

An experiment can show ​ (b)   . When one variable created a reaction by another.

เลือกจากคำด้านล่าง
correlation
causation
extrapolation
cessation
remediation
5.

On a residual plot, the following are shown:

(choose all correct answers)

a)

y-ŷ

b)

residual

c)

error

d)

observed data points

6.

Match the following

_____ in regression has a

substantially larger or smaller x-value than the

other observations have.

High-Leverage Point

_____ in regression is any point that, if removed, changes the relationship substantially.

Influential Point

Predicting a response value

using a value for the explanatory variable that is

beyond the interval of x-values used to determine

the regression line

Extrapolation

Shows two numeric values for each observation, one corresponding to the value on the x-axis and one corresponding to the value on the y-axis.

Scatterplot

Model that minimizes

the sum of the squares of the residuals and

contains the point (x̄, ȳ)

LSRL

7.
What is the type of association?
a)
Negative 
b)
no association
c)
positive 
8.
What does r stand for?
a)
correlation coefficient
b)
coefficient of determination
c)
slope of the line of best fit (LOBF) for a sample
d)
slope of the line of best fit (LOBF) for a population
9.
What does r2 stand for?
a)
correlation coefficient
b)
coefficient of determination
c)
slope of the line of best fit (LOBF) for a sample
d)
slope of the line of best fit (LOBF) for a population
10.

When r^2 is closer to 1, the relationshp between two varables is

a)

Stronger

b)

Weaker

11.

Which graphs show a negative correlation?

Select all possible answers

a)
Which graphs show a negative correlation? Select all possible answers
b)
Which graphs show a negative correlation? Select all possible answers
c)
Which graphs show a negative correlation? Select all possible answers
12.

Residual is the difference between ____________value and the ____________ value.

Write answesr separated by a comma and space.

(a)  

13.

A strong positive correlation has a r close to_____

a)

0.93

b)

0.49

c)

-1

d)

0

14.

A weak negative correlation has a r close to _______

a)

-1

b)

-0.49

c)

0.93

d)

0

15.

Match the following

Causation

Association does not imply____

Influential

points that change the correlation, "b"

y-hat is the _____ value

predicted

y is the ______

actual

LSRL

Also known as the Line of Best Fit

16.

Match the following:

Explanatory

helps influence another variable

Response

measures an outcome

Residual Plot

assesses if the LSRL is appropriate

Waygroundแป้นคำตอบ

AP Stats Chapter 3 Vocabulary

คำถามทั้งหมด: 16

1.
a, b, c, d, e
2.

Correlation Coefficient

 - 

r

, 

Coefficient of Determination

 - 

r2

, 

Standard Deviation of Residuals

 - 

s

, 

Y-Intercept

 - 

a

, 

Slope

 - 

b

3.

Gives the direction and

quantifies the strength of the linear association

between two quantitative variables.

 - 

Correlation Coefficient

, 

The proportion of variation in the response variable that is explained by the

explanatory variable in the model.

 - 

Coefficient of Determination

, 

Calculates how much the data points spread around the regression line. The result is used to measure the error of the regression line's predictability.

 - 

Standard Deviation of Residuals

, 

The value of the dependent variable when x equals zero.

 - 

Y-Intercept

, 

Change in the dependent variable divided by the change in the independent variable.

 - 

Slope

4.
correlation, causation
5.
a)

y-ŷ

, b)

residual

, c)

error

6.

_____ in regression has a

substantially larger or smaller x-value than the

other observations have.

 - 

High-Leverage Point

, 

_____ in regression is any point that, if removed, changes the relationship substantially.

 - 

Influential Point

, 

Predicting a response value

using a value for the explanatory variable that is

beyond the interval of x-values used to determine

the regression line

 - 

Extrapolation

, 

Shows two numeric values for each observation, one corresponding to the value on the x-axis and one corresponding to the value on the y-axis.

 - 

Scatterplot

, 

Model that minimizes

the sum of the squares of the residuals and

contains the point (x̄, ȳ)

 - 

LSRL

7.
b) no association
8.
a) correlation coefficient
9.
b) coefficient of determination
10.
a)

Stronger

11.
b) , a)
12.
Actual, predicted, actual, predicted
13.
a)

0.93

14.
b)

-0.49

15.

Causation

 - 

Association does not imply____

, 

Influential

 - 

points that change the correlation, "b"

, 

y-hat is the _____ value

 - 

predicted

, 

y is the ______

 - 

actual

, 

LSRL

 - 

Also known as the Line of Best Fit

16.

Explanatory

 - 

helps influence another variable

, 

Response

 - 

measures an outcome

, 

Residual Plot

 - 

assesses if the LSRL is appropriate

คำถามที่พบบ่อย

แบบฝึกหัดคำศัพท์วิชาสถิติ AP นี้ครอบคลุมหัวข้ออะไรบ้าง?

แบบฝึกหัดนี้ช่วยเสริมสร้างคำศัพท์และทักษะการตีความเกี่ยวกับความสัมพันธ์และการถดถอยเชิงเส้นผ่านคำถามแบบเรียงลำดับ จับคู่ แบบดรอปดาวน์ เลือกหลายข้อ เลือกคำตอบหลายข้อ และเติมคำในช่องว่าง นักเรียนจะได้เชื่อมโยงคำศัพท์ต่างๆ เช่น r, r², ค่าตกค้าง, จุดอิทธิพล, การประมาณค่าภายนอกช่วง และ LSRL เข้ากับความหมาย และตีความความแข็งแกร่งของความสัมพันธ์ ทิศทาง กราฟ และค่าจริงเทียบกับค่าที่ทำนายได้

ฉันจะใช้แบบฝึกหัดนี้สอนคำศัพท์เกี่ยวกับความสัมพันธ์และการวิเคราะห์การถดถอยได้อย่างไร?

หลังจากที่นักเรียนได้เรียนรู้เกี่ยวกับแผนภาพกระจาย ความสัมพันธ์ ค่าความคลาดเคลื่อน และการถดถอยกำลังสองน้อยที่สุดแล้ว ให้เริ่มใช้แบบฝึกหัดนี้ จากนั้นใช้แบบฝึกหัดจับคู่เพื่อให้นักเรียนอธิบายแต่ละคำศัพท์ด้วยคำพูดของตนเอง ต่อด้วยแบบฝึกหัดการตีความ โดยถามนักเรียนว่าเหตุใดค่า r ที่เลือกจึงแสดงถึงความสัมพันธ์เชิงบวกที่แข็งแกร่งหรือความสัมพันธ์เชิงลบที่อ่อนแอ และเหตุใด r² จึงอธิบายถึงความแปรปรวนที่อธิบายได้

ฉันควรระวังข้อผิดพลาดอะไรบ้างในแบบฝึกหัดวิชาสถิติ AP นี้?

ระวังนักเรียนที่สับสนระหว่างสัมประสิทธิ์สหสัมพันธ์ r กับสัมประสิทธิ์การกำหนด r² หรือใช้ r² เป็นตัววัดทิศทางแทนที่จะเป็นตัววัดความแปรปรวนที่อธิบายได้ นักเรียนอาจสับสนระหว่างสหสัมพันธ์และสาเหตุ สลับค่าจริงและค่าที่ทำนายไว้ในคำจำกัดความของค่าตกค้าง หรือมองข้ามไปว่าข้อสอบแบบเลือกหลายข้ออาจต้องการคำตอบมากกว่าหนึ่งข้อเมื่อระบุส่วนประกอบของกราฟค่าตกค้างหรือกราฟสหสัมพันธ์เชิงลบ

ฉันจะมอบหมายและให้คะแนนแบบฝึกหัดวิชาสถิติ AP นี้อย่างไร?

สามารถส่งงานเป็นไฟล์ PDF ที่พิมพ์ได้ หรือเป็นแบบทดสอบดิจิทัลบน Wayground ก็ได้ แบบฝึกหัดนี้มีเฉลยคำตอบครบถ้วนสำหรับตรวจสอบลำดับ การจับคู่คำศัพท์ การตีความ และคำถามตอบคำถาม สำหรับการส่งงานแบบพิมพ์ ครูสามารถสแกนงานของนักเรียนด้วยแอป Wayground for Teachers เพื่อตรวจให้คะแนนได้อย่างมีประสิทธิภาพ

ฉันจะปรับแบบฝึกหัดคำศัพท์เกี่ยวกับความสัมพันธ์และการถดถอยนี้ให้เหมาะสมกับนักเรียนของฉันได้อย่างไร?

สำหรับแบบฝึกหัดที่มีการจับคู่และคำจำกัดความจำนวนมาก ให้ปรับระยะห่างระหว่างตัวอักษรหรือเพิ่มขนาดตัวอักษรเพื่อให้ง่ายต่อการติดตามคำศัพท์และคำอธิบาย ในการตั้งค่าขั้นสูงของแบบฝึกหัด คุณยังสามารถเปิดใช้งานแบบอักษรที่เหมาะสำหรับผู้ที่มีภาวะดิสเล็กเซีย หรือแปลแบบฝึกหัดเป็นภาษาอื่นได้ เมื่อตัวเลือกเหล่านั้นรองรับการเข้าถึงคำศัพท์ที่เกี่ยวข้องกับความสัมพันธ์และการถดถอย

ฉันจะหาแบบฝึกหัดแบบนี้เพิ่มเติมได้ที่ไหนบน Wayground?

Wayground มีแบบฝึกหัดและโจทย์ฝึกหัดมากมายให้ดาวน์โหลดฟรีในหลากหลายวิชา พร้อมไฟล์ PDF และเฉลยคำตอบ เพื่อช่วยให้นักเรียนพัฒนาทักษะและความเข้าใจในแนวคิดสำคัญๆ ดูแหล่งข้อมูลเพิ่มเติมได้ที่ https://wayground.com/en-us/worksheets