
Wayground
Supply and Demand - Printable สังคมศึกษา Worksheets ระดับ 12 - Wayground

Supply and Demand

John Moody

สร้างโดย John Moody

15 คำถาม

12th ระดับชั้น

สังคมศึกษา

อัปเดตแล้ว ก.ค. 2569

แบบฝึกหัดเรื่องอุปสงค์และอุปทานสำหรับนักเรียนชั้นมัธยมศึกษาปีที่ 6 (เกรด 12) ประกอบด้วยคำถามแบบเลือกตอบ 15 ข้อ เพื่อเสริมสร้างความเข้าใจเกี่ยวกับวิธีการที่ผู้ซื้อและผู้ขายกำหนดอุปสงค์และอุปทาน นักเรียนจะได้เรียนรู้เกี่ยวกับกฎของอุปสงค์ จุดสมดุล สินค้าที่ใช้ร่วมกัน ปัจจัยที่ส่งผลต่อการเปลี่ยนแปลงของอุปสงค์ และปฏิสัมพันธ์ระหว่างผู้ผลิตและผู้บริโภคในการกำหนดราคา แบบฝึกหัดนี้ยังช่วยให้นักเรียนตีความเส้นและกราฟอุปสงค์และอุปทาน แยกแยะความแตกต่างระหว่างการเปลี่ยนแปลงของปริมาณและการเปลี่ยนแปลงของการเปลี่ยนแปลง ระบุสินค้าคงเหลือ และกำหนดราคาขั้นต่ำเพื่อระบุปริมาณที่ซื้อ แบบฝึกหัดนี้เน้นการฝึกฝนเกี่ยวกับราคาดุลยภาพ ปริมาณอุปทาน และปัจจัยที่ส่งผลต่อการเปลี่ยนแปลงของเส้นอุปทาน รวมถึงต้นทุนการผลิต เทคโนโลยี และจำนวนผู้ขาย แบบฝึกหัดที่พิมพ์ได้ฟรีนี้มีเฉลยคำตอบครบถ้วนเพื่อการตรวจสอบ ทบทวน หรือประเมินผลอย่างมีประสิทธิภาพ

การตั้งค่าแผ่นงาน

ขนาดตัวอักษร

S
M
L
XL
Waygroundแผ่นงาน

Supply and Demand

คำถามทั้งหมด: 15

ชื่อ
ระดับ
วันที่
1.
This part of the market determines DEMAND
a)
buyers
b)
sellers
c)
suppliers
d)
store owners
2.
This part of the market determines SUPPLY
a)
buyers
b)
sellers
c)
consumers
d)
us
3.
For the law of demand, as price rises, what happens to quantity demanded?
a)
it goes up
b)
it goes down
c)
it stays the same
d)
it is not effected
4.
When quantity supplied and quantity demanded is equal
a)
surplus
b)
shortage
c)
equilibrium
d)
law of demand
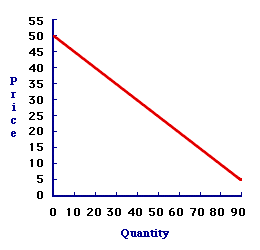
5.
What does this curve represent?
a)
supply
b)
equilibrium
c)
demand
d)
surplus
6.
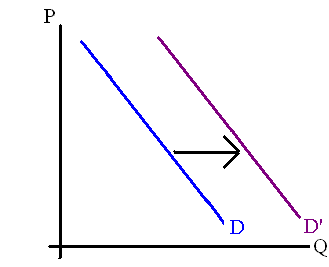
The diagram represents a
a)
increase in demand
b)
decrease in demand
c)
change in quantity demand
d)
none of the above
7.
Goods that are bought and used together are 
a)
complementary goods
b)
substitute goods
c)
income goods
d)
unrelated goods
8.
Thousands of people leave a small town due to a factory closing down.  Sales at the local grocery store become slow. What causes this change?
a)
Prices or availability of substitutes
b)
Prices or availability of complementary goods
c)
Change in the weather or season
d)
Change in the number of buyers
9.
Which of the following is likely to increase the demand for peanut butter?
a)
Fewer children in the population
b)
News that insects have destroyed much of the peanut crop and that there will be less peanut butter on the shelves in three months.
c)
A big increase in the price of jelly.
d)
A report from the Surgeon General of the United States that eating peanut butter makes people nutty.
10.
Which statement expresses a central idea of how the laws of supply and demand work?
a)
The government sets the prices for goods and services.
b)
Prices are determined by the interaction of producers and consumers.
c)
Consumers alone determine the prices for goods and services.
d)
Technology dictates the prices charged for goods and services.
11.
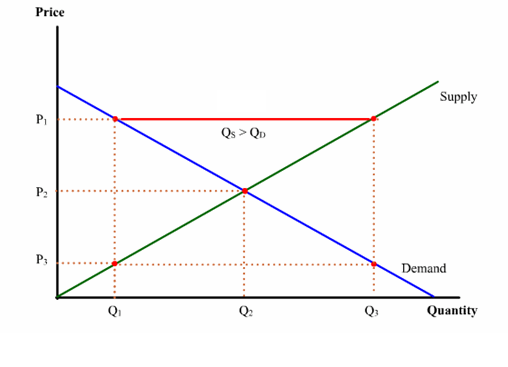
What does this graph show?
a)
Shortage
b)
Surplus
c)
Supply Table
d)
Equilibrium
12.
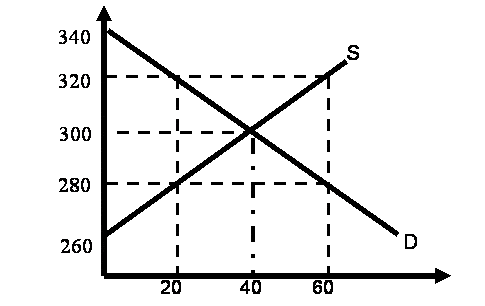
If a price floor was set at 320, what quantity would be purchased?
a)
20
b)
40
c)
60
d)
80
13.
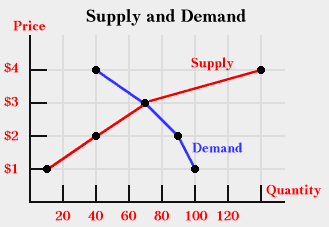
What is the Equilibrium Price?
a)
1
b)
2
c)
3
d)
4
14.
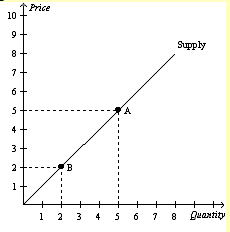
The movement from Point A to Point B represents a(n)
a)
increase in the price.
b)
decrease in the quantity supplied.
c)
shift in the supply curve.
d)
Both Orange and Blue are correct.
15.
Which of the following would not shift the supply curve for iphones?
a)
an increase in the price of iphones
b)
a decrease in the number of sellers of iphone
c)
an increase in the price of plastic, an input into the production of iphones
d)
an improvement in the technology used to produce iphones
Waygroundแป้นคำตอบ

Supply and Demand

คำถามทั้งหมด: 15

1.
a) buyers
2.
b) sellers
3.
b) it goes down
4.
c) equilibrium
5.
c) demand
6.
a) increase in demand
7.
a) complementary goods
8.
d) Change in the number of buyers
9.
b) News that insects have destroyed much of the peanut crop and that there will be less peanut butter on the shelves in three months.
10.
b) Prices are determined by the interaction of producers and consumers.
11.
b) Surplus
12.
a) 20
13.
c) 3
14.
b) decrease in the quantity supplied.
15.
a) an increase in the price of iphones

คำถามที่พบบ่อย

แบบฝึกหัดเรื่องอุปสงค์และอุปทานครอบคลุมหัวข้ออะไรบ้าง?

แบบฝึกหัดวิชาเศรษฐศาสตร์ ชั้นมัธยมศึกษาปีที่ 6 นี้ ประกอบด้วยคำถามแบบเลือกตอบ 15 ข้อ เกี่ยวกับวิธีที่ผู้ซื้อกำหนดอุปสงค์และผู้ขายกำหนดอุปทาน นักเรียนจะได้ประยุกต์ใช้กฎของอุปสงค์ ระบุจุดสมดุล ส่วนเกิน และการเปลี่ยนแปลงของเส้นอุปสงค์ จัดประเภทสินค้าที่ใช้ร่วมกัน ตีความกราฟอุปสงค์และอุปทาน คำนวณผลลัพธ์จากราคาขั้นต่ำ และแยกแยะความแตกต่างระหว่างการเปลี่ยนแปลงของเส้นอุปสงค์และอุปทานกับการเปลี่ยนแปลงปริมาณ

ฉันจะใช้แบบฝึกหัดนี้ในการสอนเรื่องอุปสงค์และอุปทานได้อย่างไร?

เริ่มแบบฝึกหัดโดยทบทวนเรื่องผู้ซื้อ ผู้ขาย อุปสงค์ อุปทาน และกฎของอุปสงค์ จากนั้นสาธิตวิธีการอ่านกราฟอุปสงค์หรืออุปทานก่อนที่นักเรียนจะทำงานด้วยตนเอง หยุดที่กราฟ จุดสมดุล และราคาขั้นต่ำ แล้วถามนักเรียนว่าสถานการณ์นั้นเปลี่ยนแปลงราคา ปริมาณ หรือตำแหน่งของเส้นกราฟหรือไม่ ใช้คำถามสถานการณ์เกี่ยวกับความเปลี่ยนแปลงของประชากร เนยถั่วลิสง และการผลิตไอโฟน เพื่อเชื่อมโยงแนวคิดทางการตลาดกับการตัดสินใจในชีวิตจริง

ฉันควรระวังข้อผิดพลาดอะไรบ้างเมื่อนักเรียนทำแบบฝึกหัดเรื่องอุปสงค์และอุปทานนี้?

ระวังนักเรียนที่สับสนระหว่างอุปสงค์กับปริมาณที่ต้องการซื้อ หรืออุปทานกับปริมาณที่เสนอขาย โดยเฉพาะอย่างยิ่งเมื่อต้องตัดสินใจว่ากราฟแสดงการเลื่อนของเส้นโค้งหรือการเคลื่อนที่ไปตามเส้นโค้ง นักเรียนอาจสับสนระหว่างดุลยภาพ ส่วนเกิน และการขาดแคลน หรือระบุสินค้าที่ใช้ร่วมกันและสินค้าทดแทนผิดพลาด เมื่อทบทวนคำถามเกี่ยวกับราคาขั้นต่ำและกราฟ ให้ขอให้นักเรียนระบุราคาและปริมาณที่เกี่ยวข้องแทนที่จะเลือกตัวเลือกจากกราฟโดยการเดา

ฉันจะมอบหมายและให้คะแนนแบบฝึกหัดเรื่องอุปสงค์และอุปทานนี้อย่างไร?

คุณสามารถมอบหมายแบบทดสอบนี้ในรูปแบบไฟล์ PDF ที่พิมพ์ได้ หรือเป็นแบบทดสอบดิจิทัลบน Wayground ก็ได้ ทั้งสองเวอร์ชันประกอบด้วยคำถามปรนัย 15 ข้อเหมือนกัน เกี่ยวกับความสัมพันธ์ระหว่างอุปสงค์และอุปทาน และการตีความกราฟ มีเฉลยคำตอบครบถ้วนสำหรับการตรวจสอบคำตอบ และสามารถตรวจให้คะแนนงานที่ส่งในรูปแบบไฟล์พิมพ์ได้โดยการสแกนงานของนักเรียนด้วยแอป Wayground for Teachers รูปแบบไฟล์พิมพ์ยังช่วยให้โรงเรียนมีตัวเลือกในการลดเวลาการใช้หน้าจอได้อีกด้วย

ฉันจะปรับแบบฝึกหัดเรื่องอุปสงค์และอุปทานนี้ให้เหมาะสมกับนักเรียนของฉันได้อย่างไร?

ใช้การตั้งค่าขั้นสูงของแบบฝึกหัดเพื่อปรับระยะห่างระหว่างตัวอักษรหรือเลือกขนาดตัวอักษรที่ใหญ่ขึ้น เพื่อให้ตัวเลือกแบบปรนัยและคำถามแบบกราฟอ่านง่ายขึ้น นอกจากนี้ คุณยังสามารถใช้แบบอักษรที่เหมาะสำหรับผู้ที่มีภาวะดิสเล็กเซีย หรือแปลแบบฝึกหัดเป็นภาษาอื่นได้ เมื่อการเปลี่ยนแปลงเหล่านั้นช่วยให้เข้าถึงคำศัพท์และสถานการณ์ทางเศรษฐศาสตร์ได้ง่ายขึ้น

ฉันจะหาแบบฝึกหัดแบบนี้เพิ่มเติมได้ที่ไหนบน Wayground?

Wayground มีแบบฝึกหัดและโจทย์ฝึกหัดมากมายให้ดาวน์โหลดฟรีในหลากหลายวิชา พร้อมไฟล์ PDF และเฉลยคำตอบ เพื่อช่วยให้นักเรียนพัฒนาทักษะและความเข้าใจในแนวคิดสำคัญๆ ดูแหล่งข้อมูลเพิ่มเติมได้ที่ https://wayground.com/en-us/worksheets