
 แผ่นงาน
Area Model vs Tree Diagram
คำถามทั้งหมด: 10
ชื่อ
ระดับ
วันที่

 แป้นคำตอบ
Area Model vs Tree Diagram
คำถามทั้งหมด: 10
1.
d)
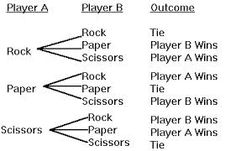
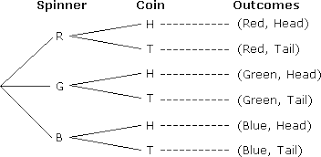
A tree diagram is used to visually represent and count all possible outcomes of an event or experiment.
2.
b)
A probability area model is a visual representation of the probabilities of different outcomes in a probability experiment.
3.
a)
The limitations of using a probability tree diagram are that they can become complex and difficult to read when there are many possible outcomes or events, and they assume that the events are independent.
4.
d)
Flipping a coin twice
5.
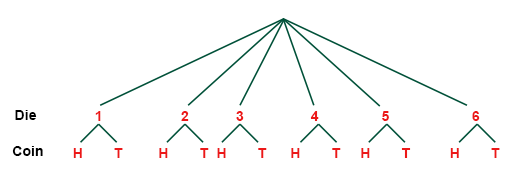
b) 12
6.
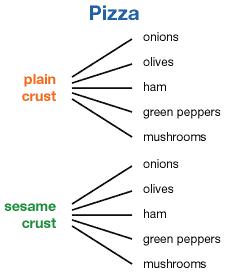
d) 5/12
7.
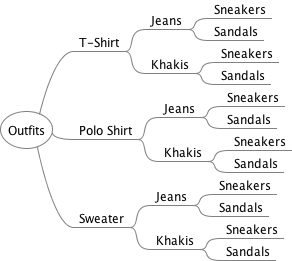
a) 12
8.
b) HH, HT, TH, TT
9.
a)
10.
ไม่มี